National Real Estate Insights - November 2024 Compass Report
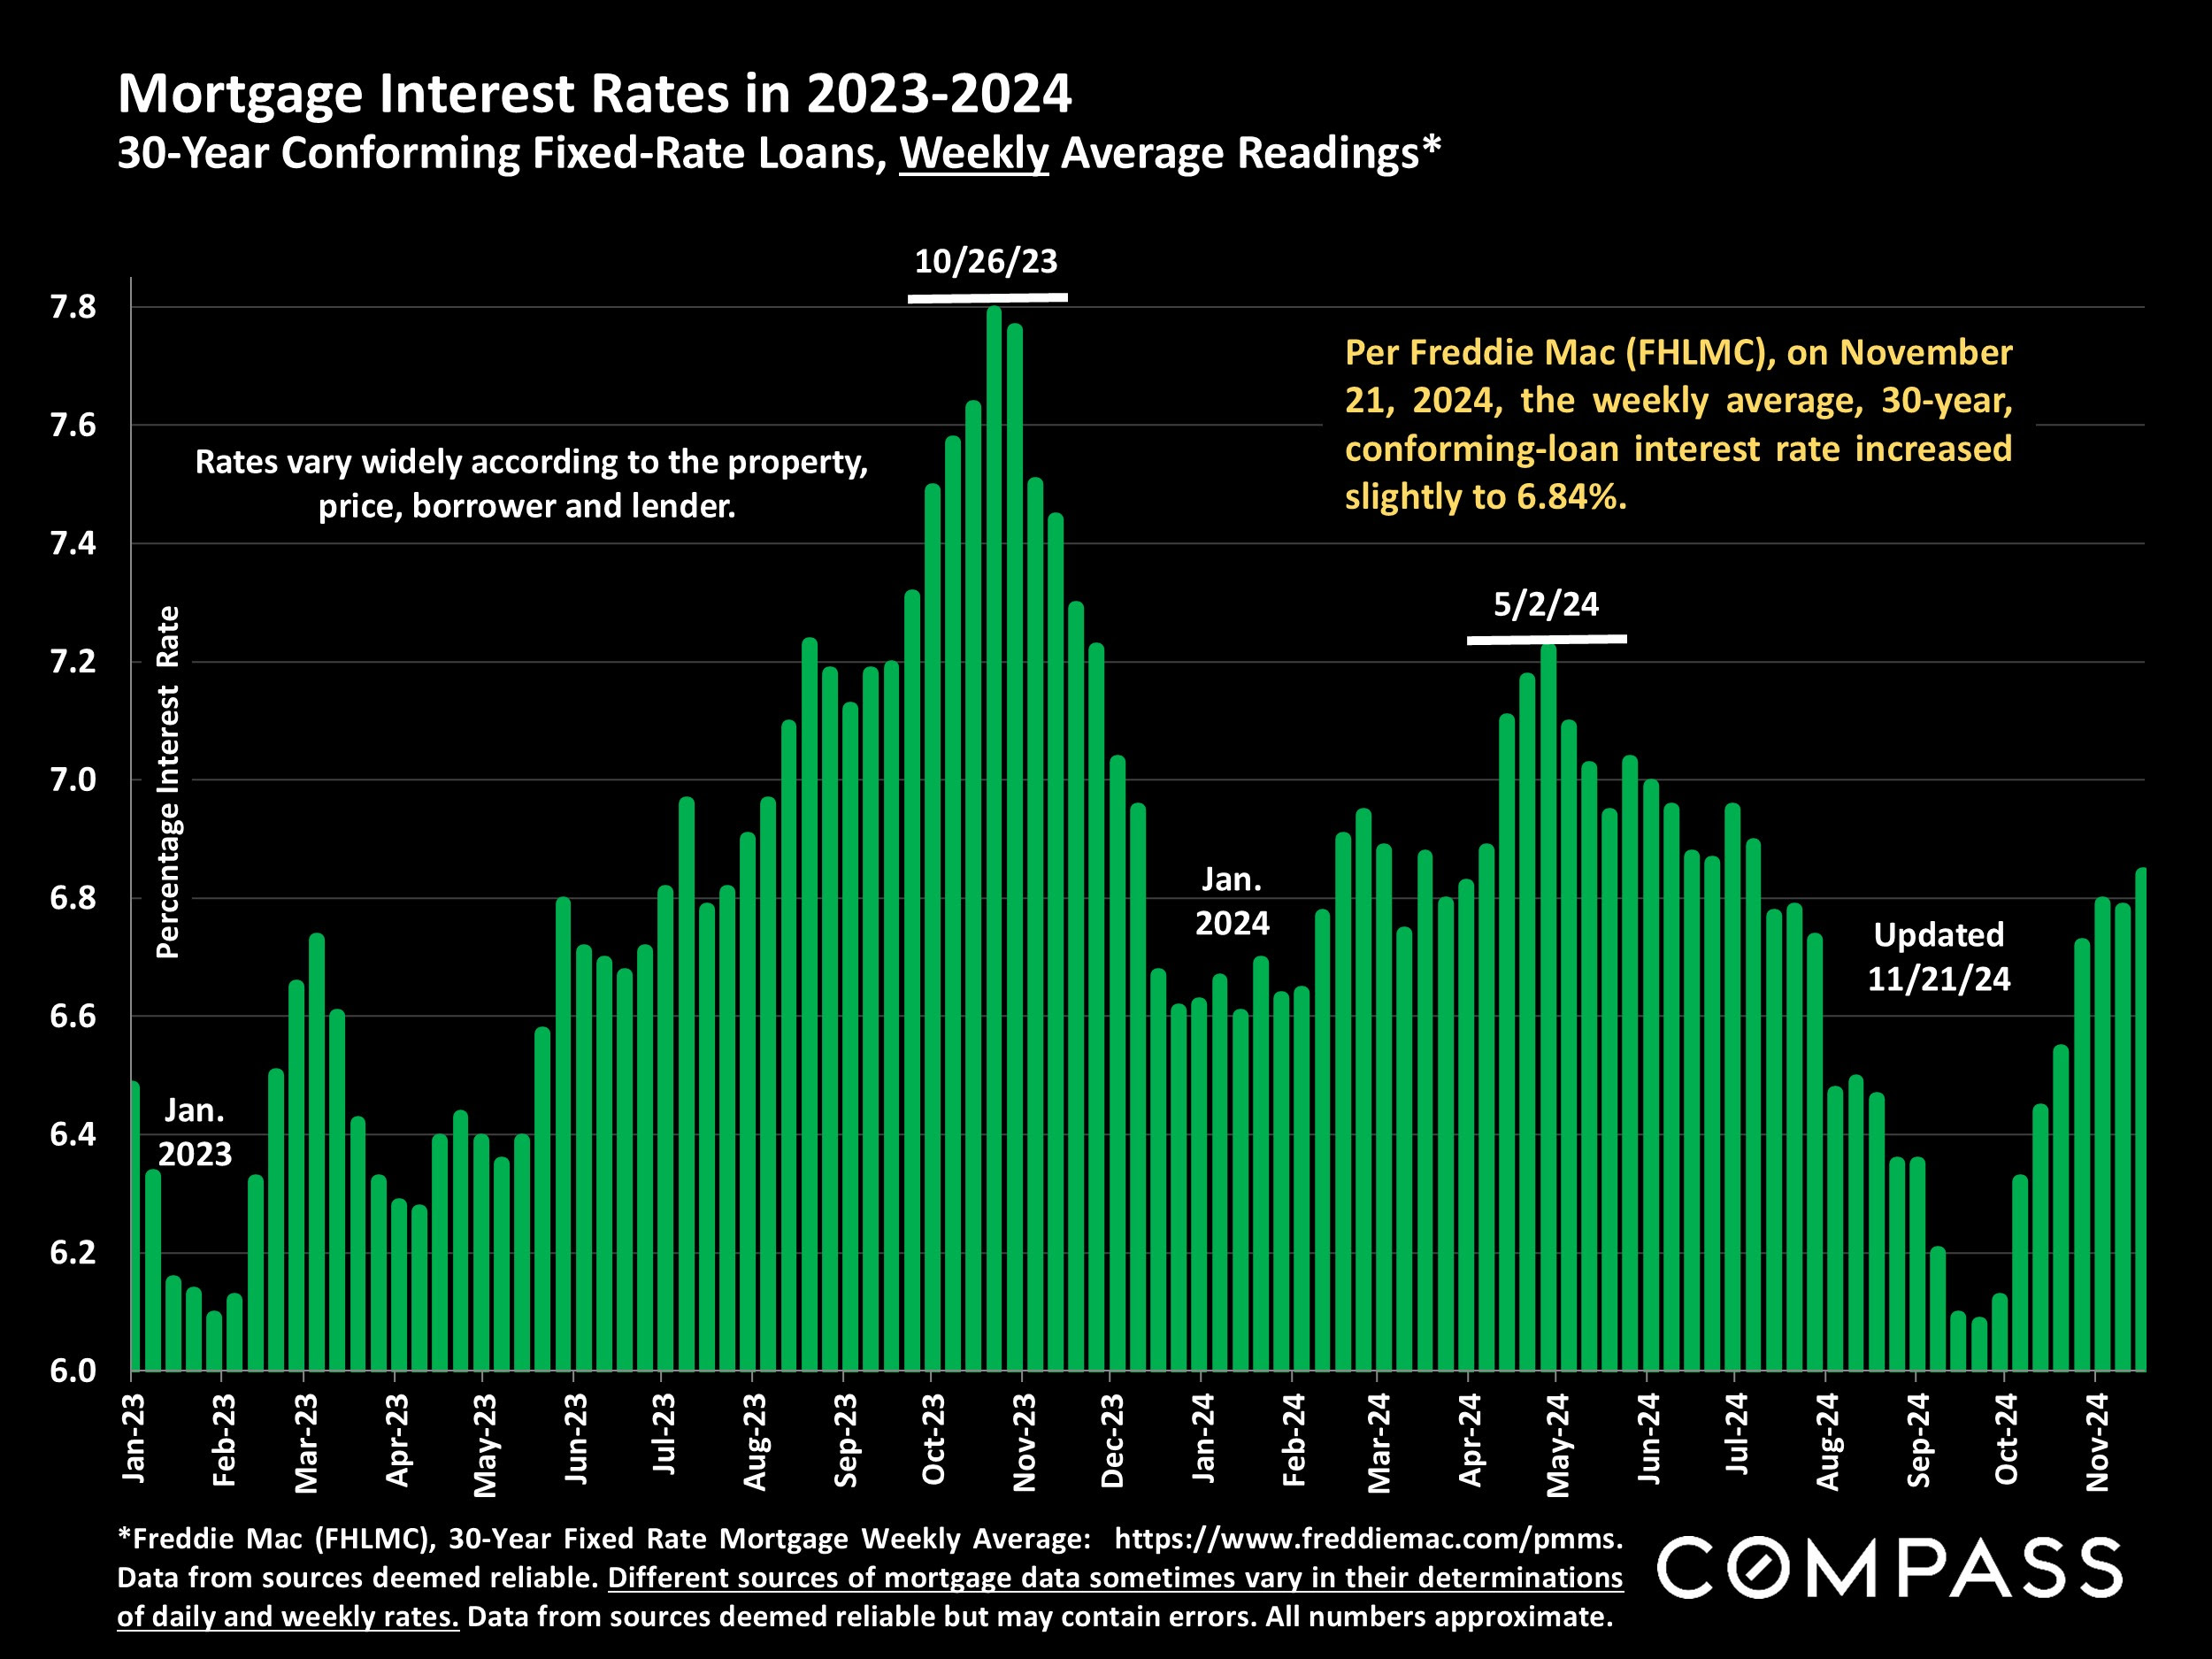
Over the past 2 months, after the substantial decline from spring to early autumn, interest rates reversed course to rise again.
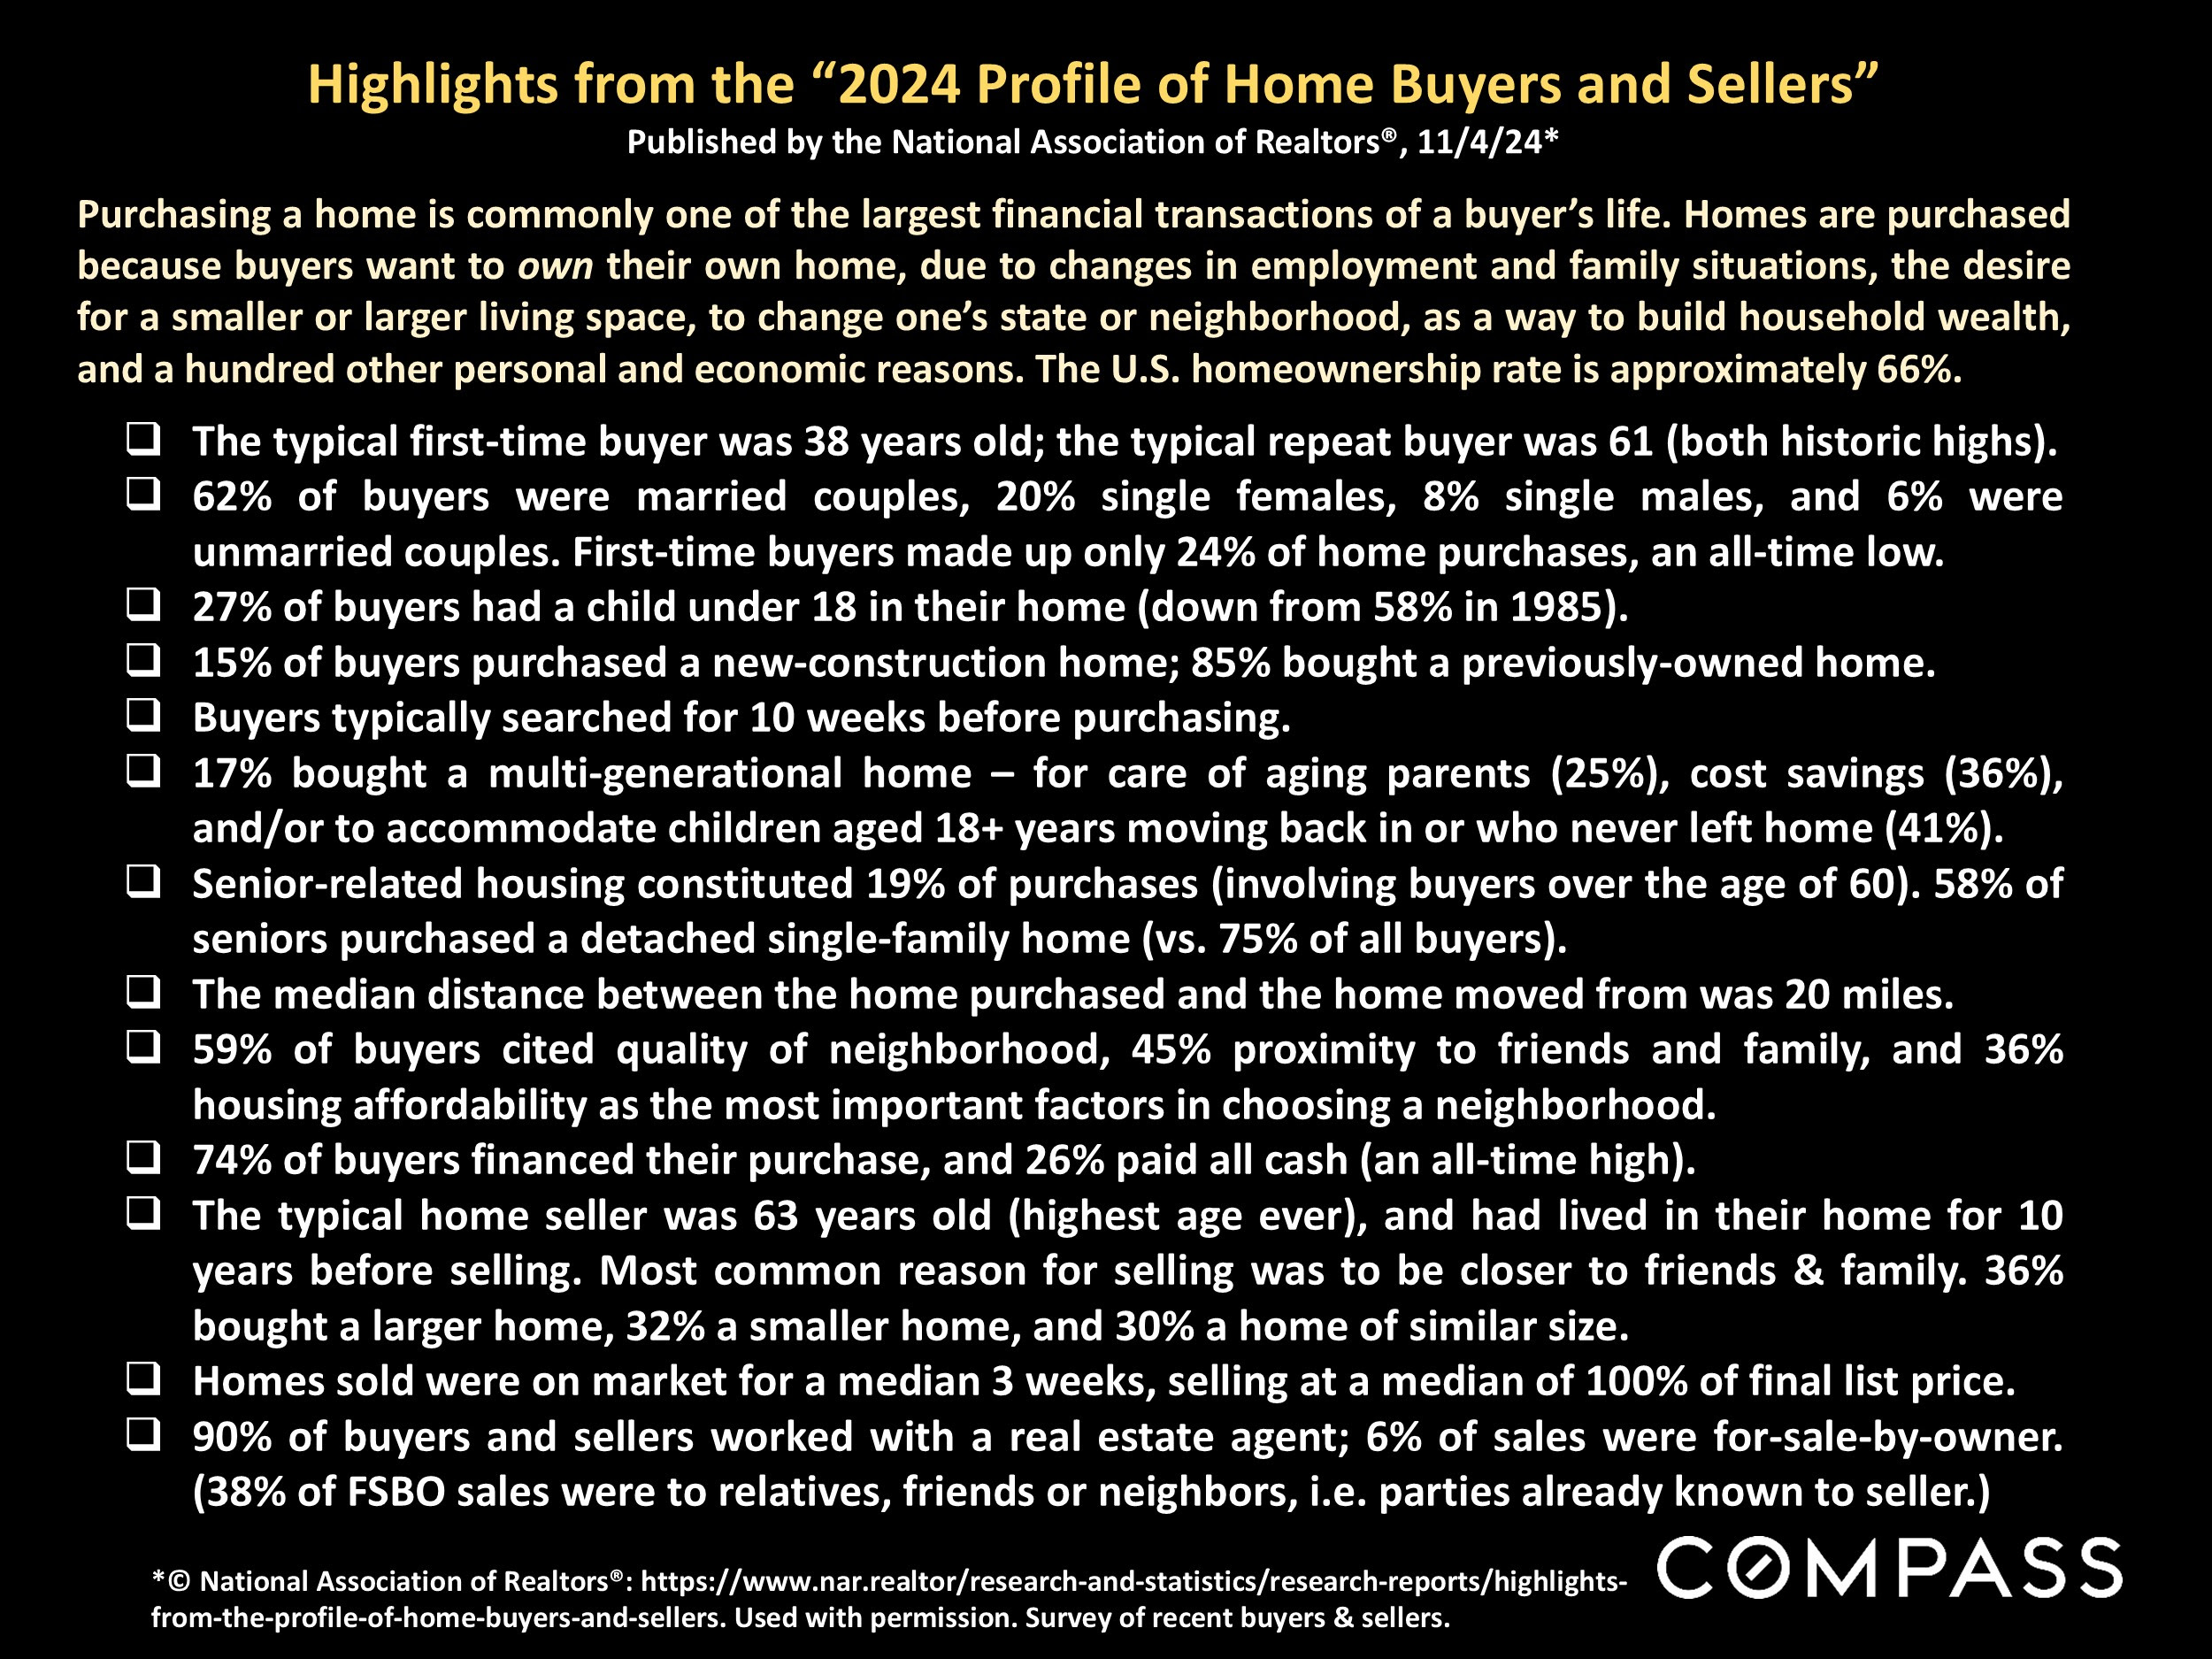
The National Association of Realtors just published their 2024 review of statistics pertaining to U.S. buyers and sellers. Below are some highlights of that report.
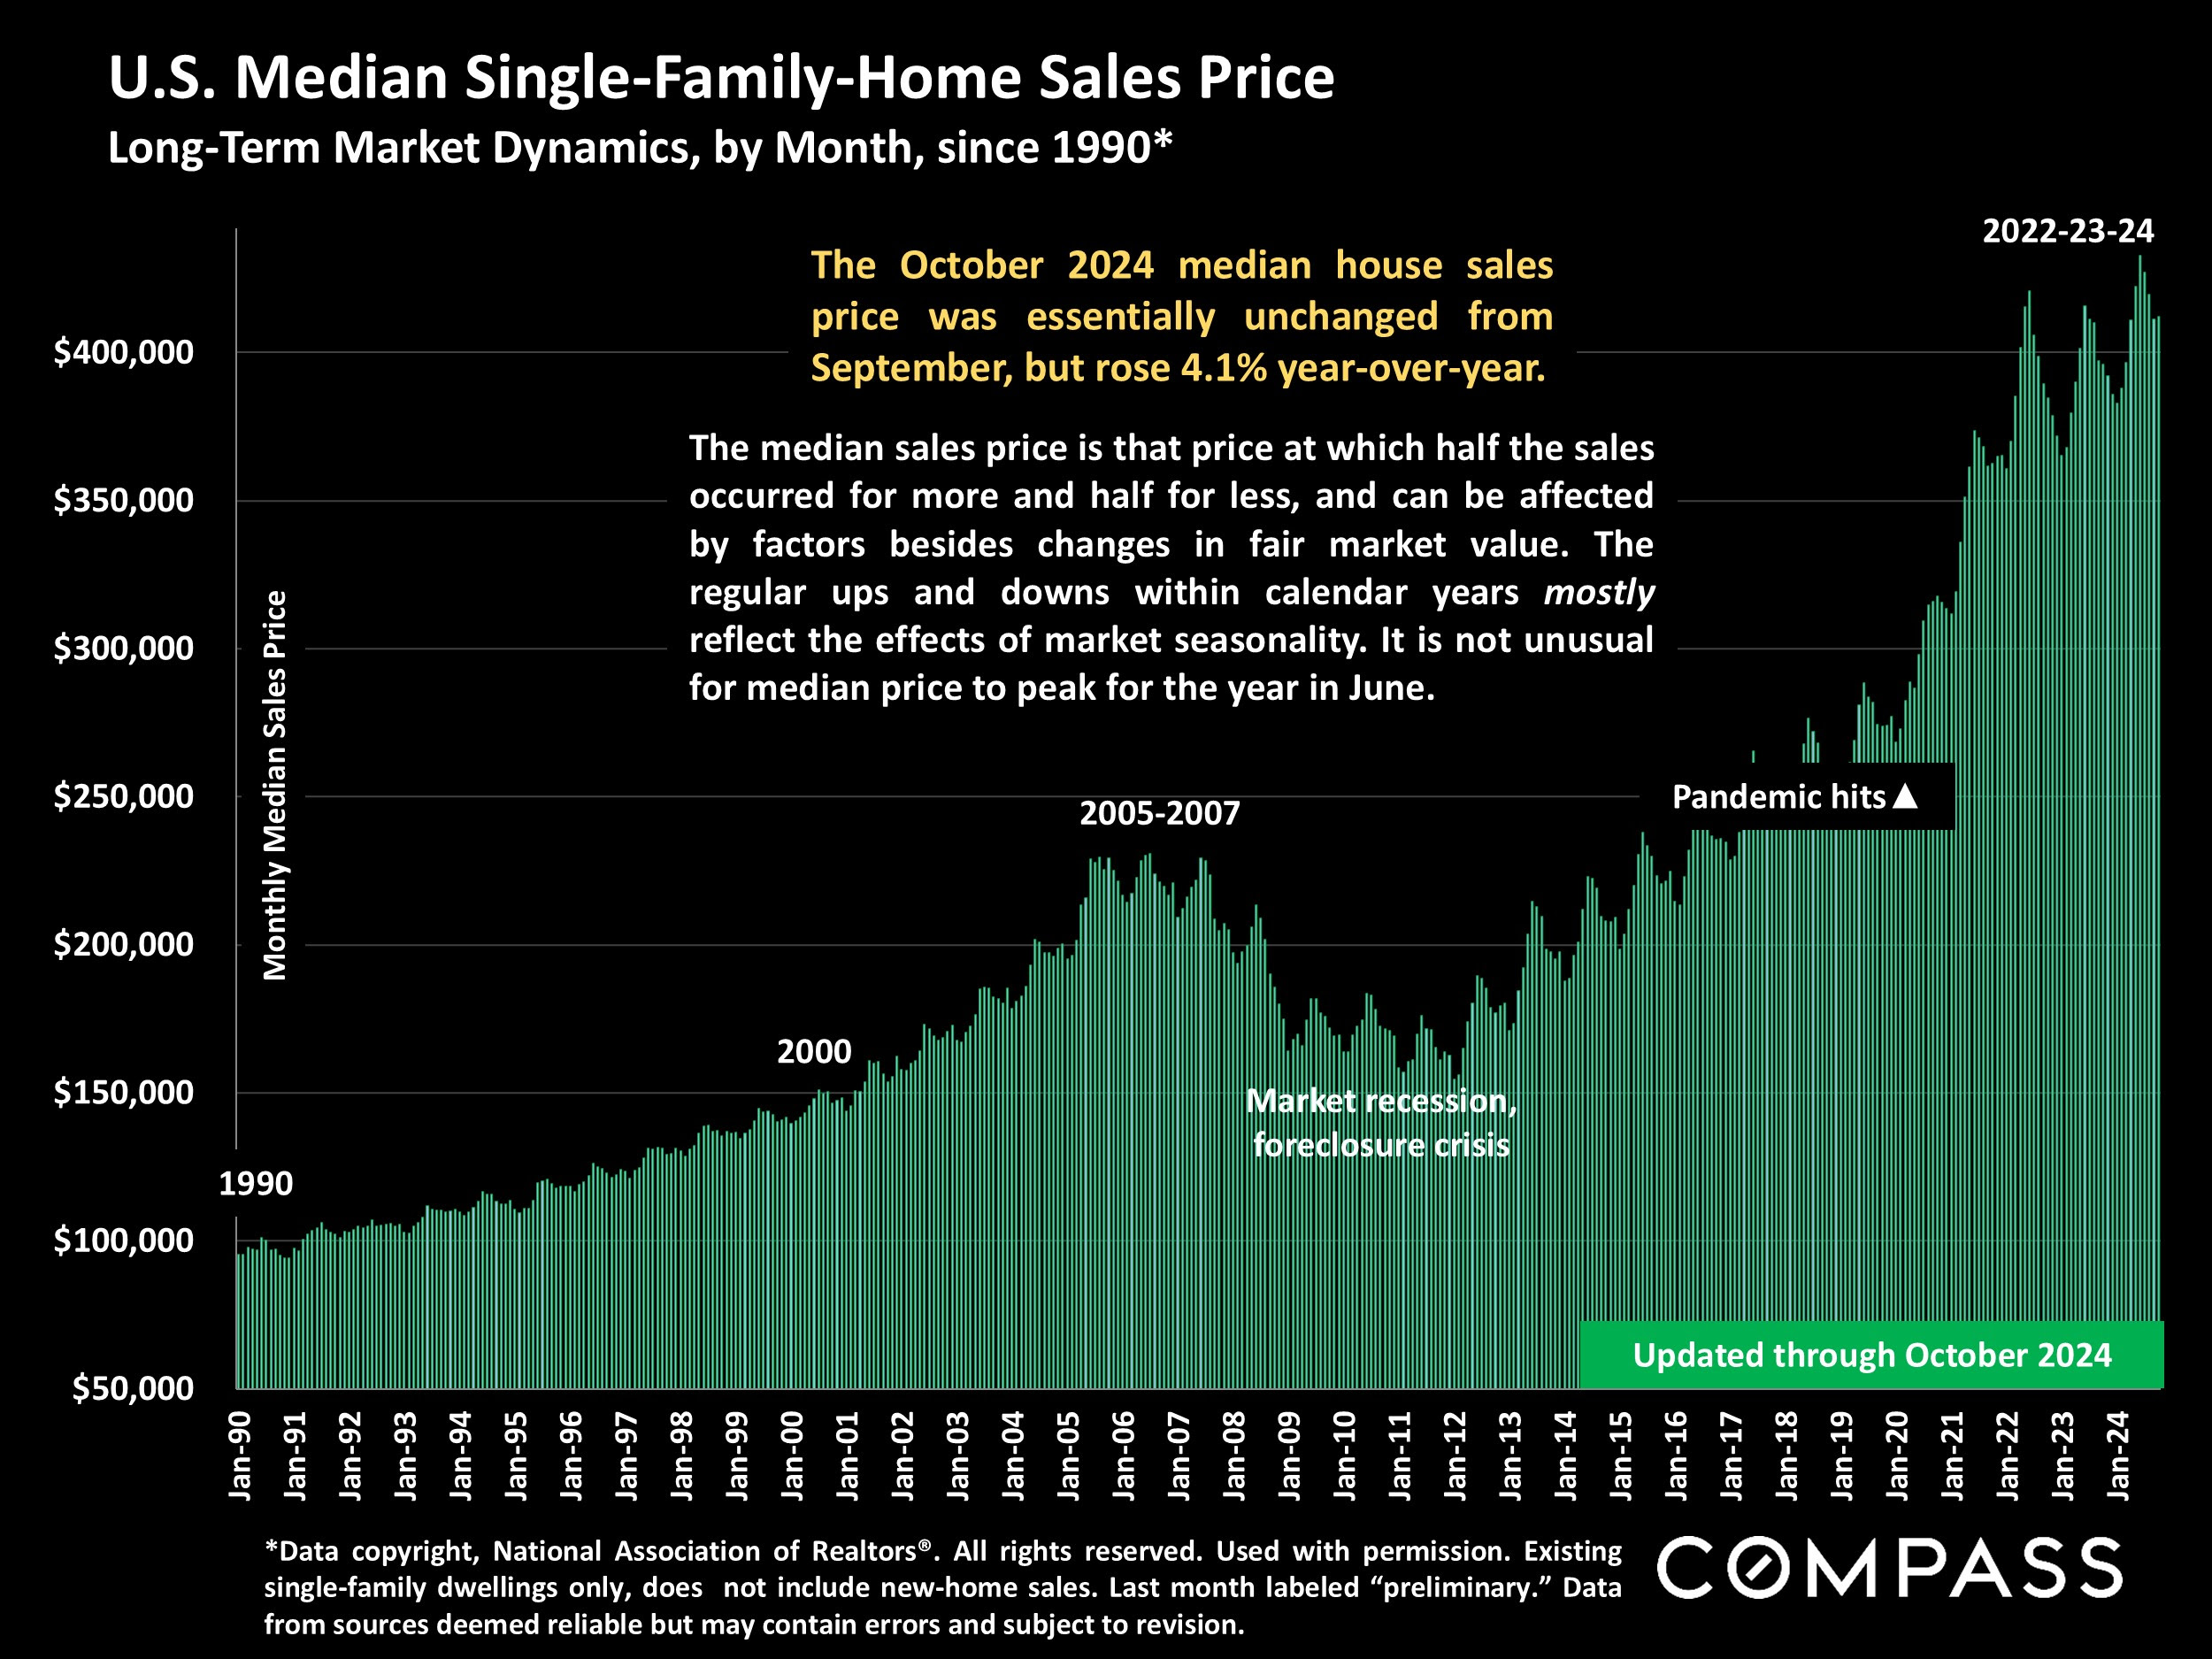
A long-term illustration of the national median house sales price.
Note that seasonal ebbs and flows in sales price are common.
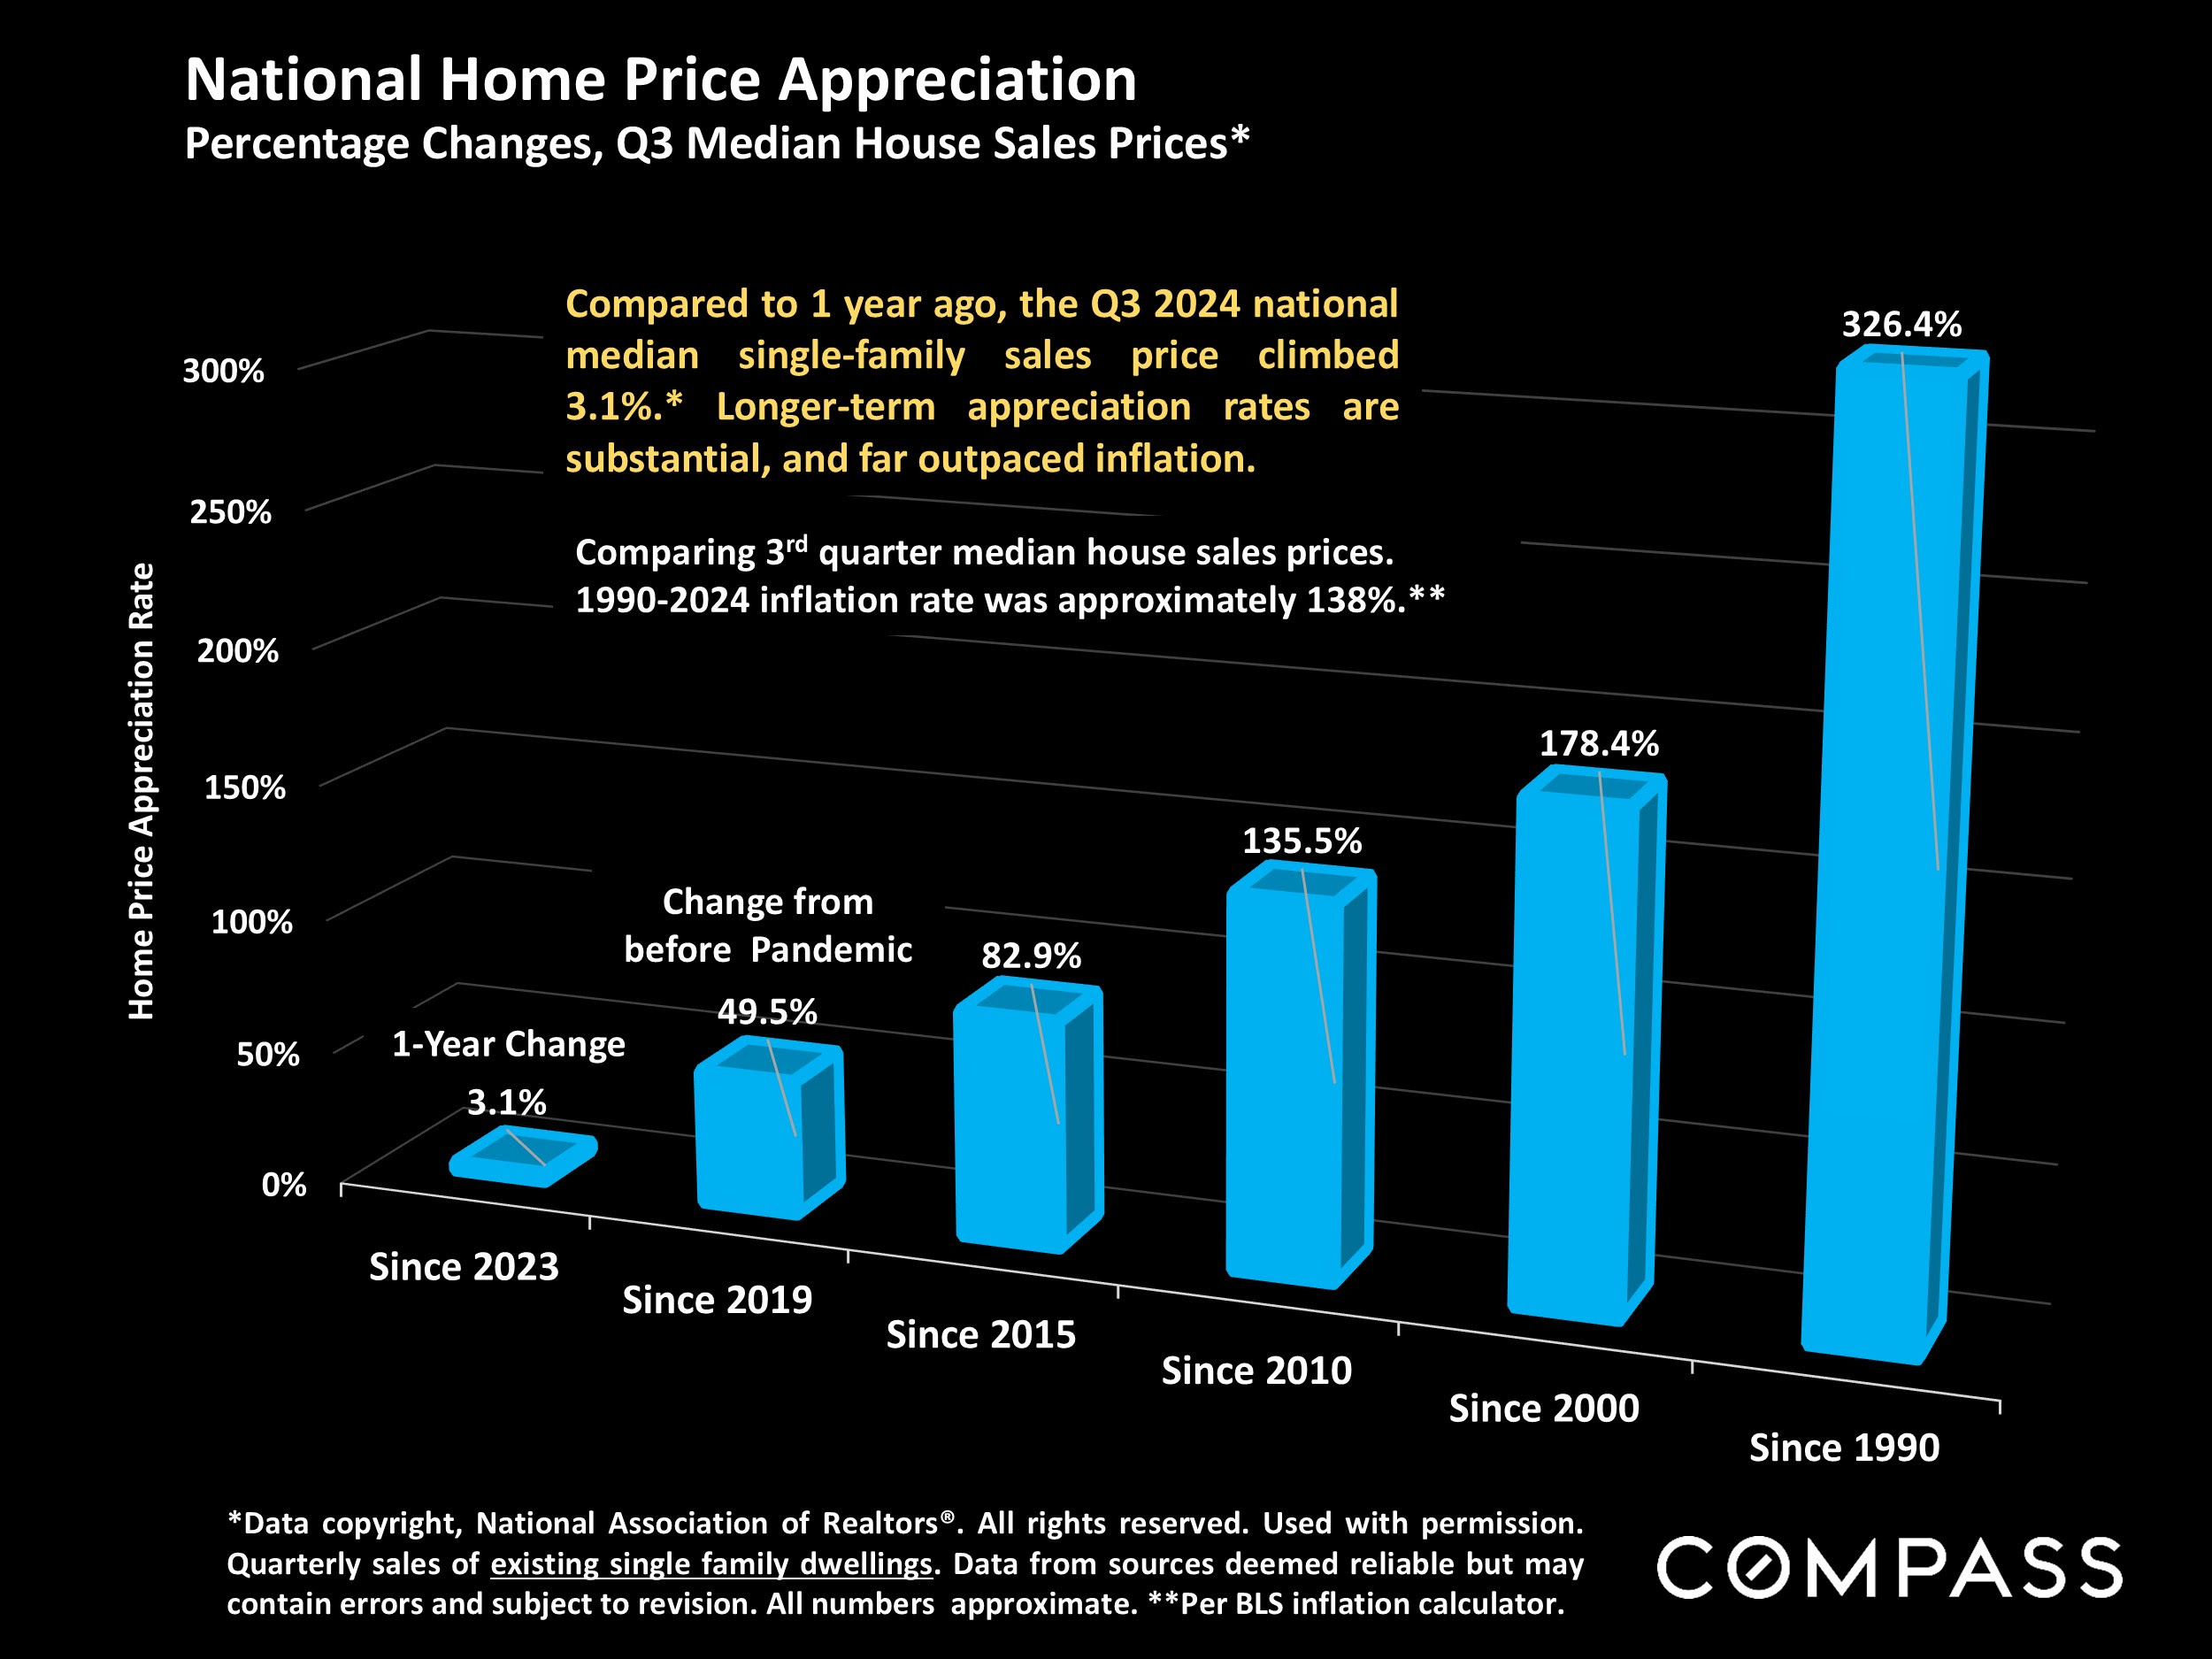
National house-price appreciation rates since 1990, using quarterly data: The median sales price has continued to rise, but not at the torrid pace seen during the pandemic boom.
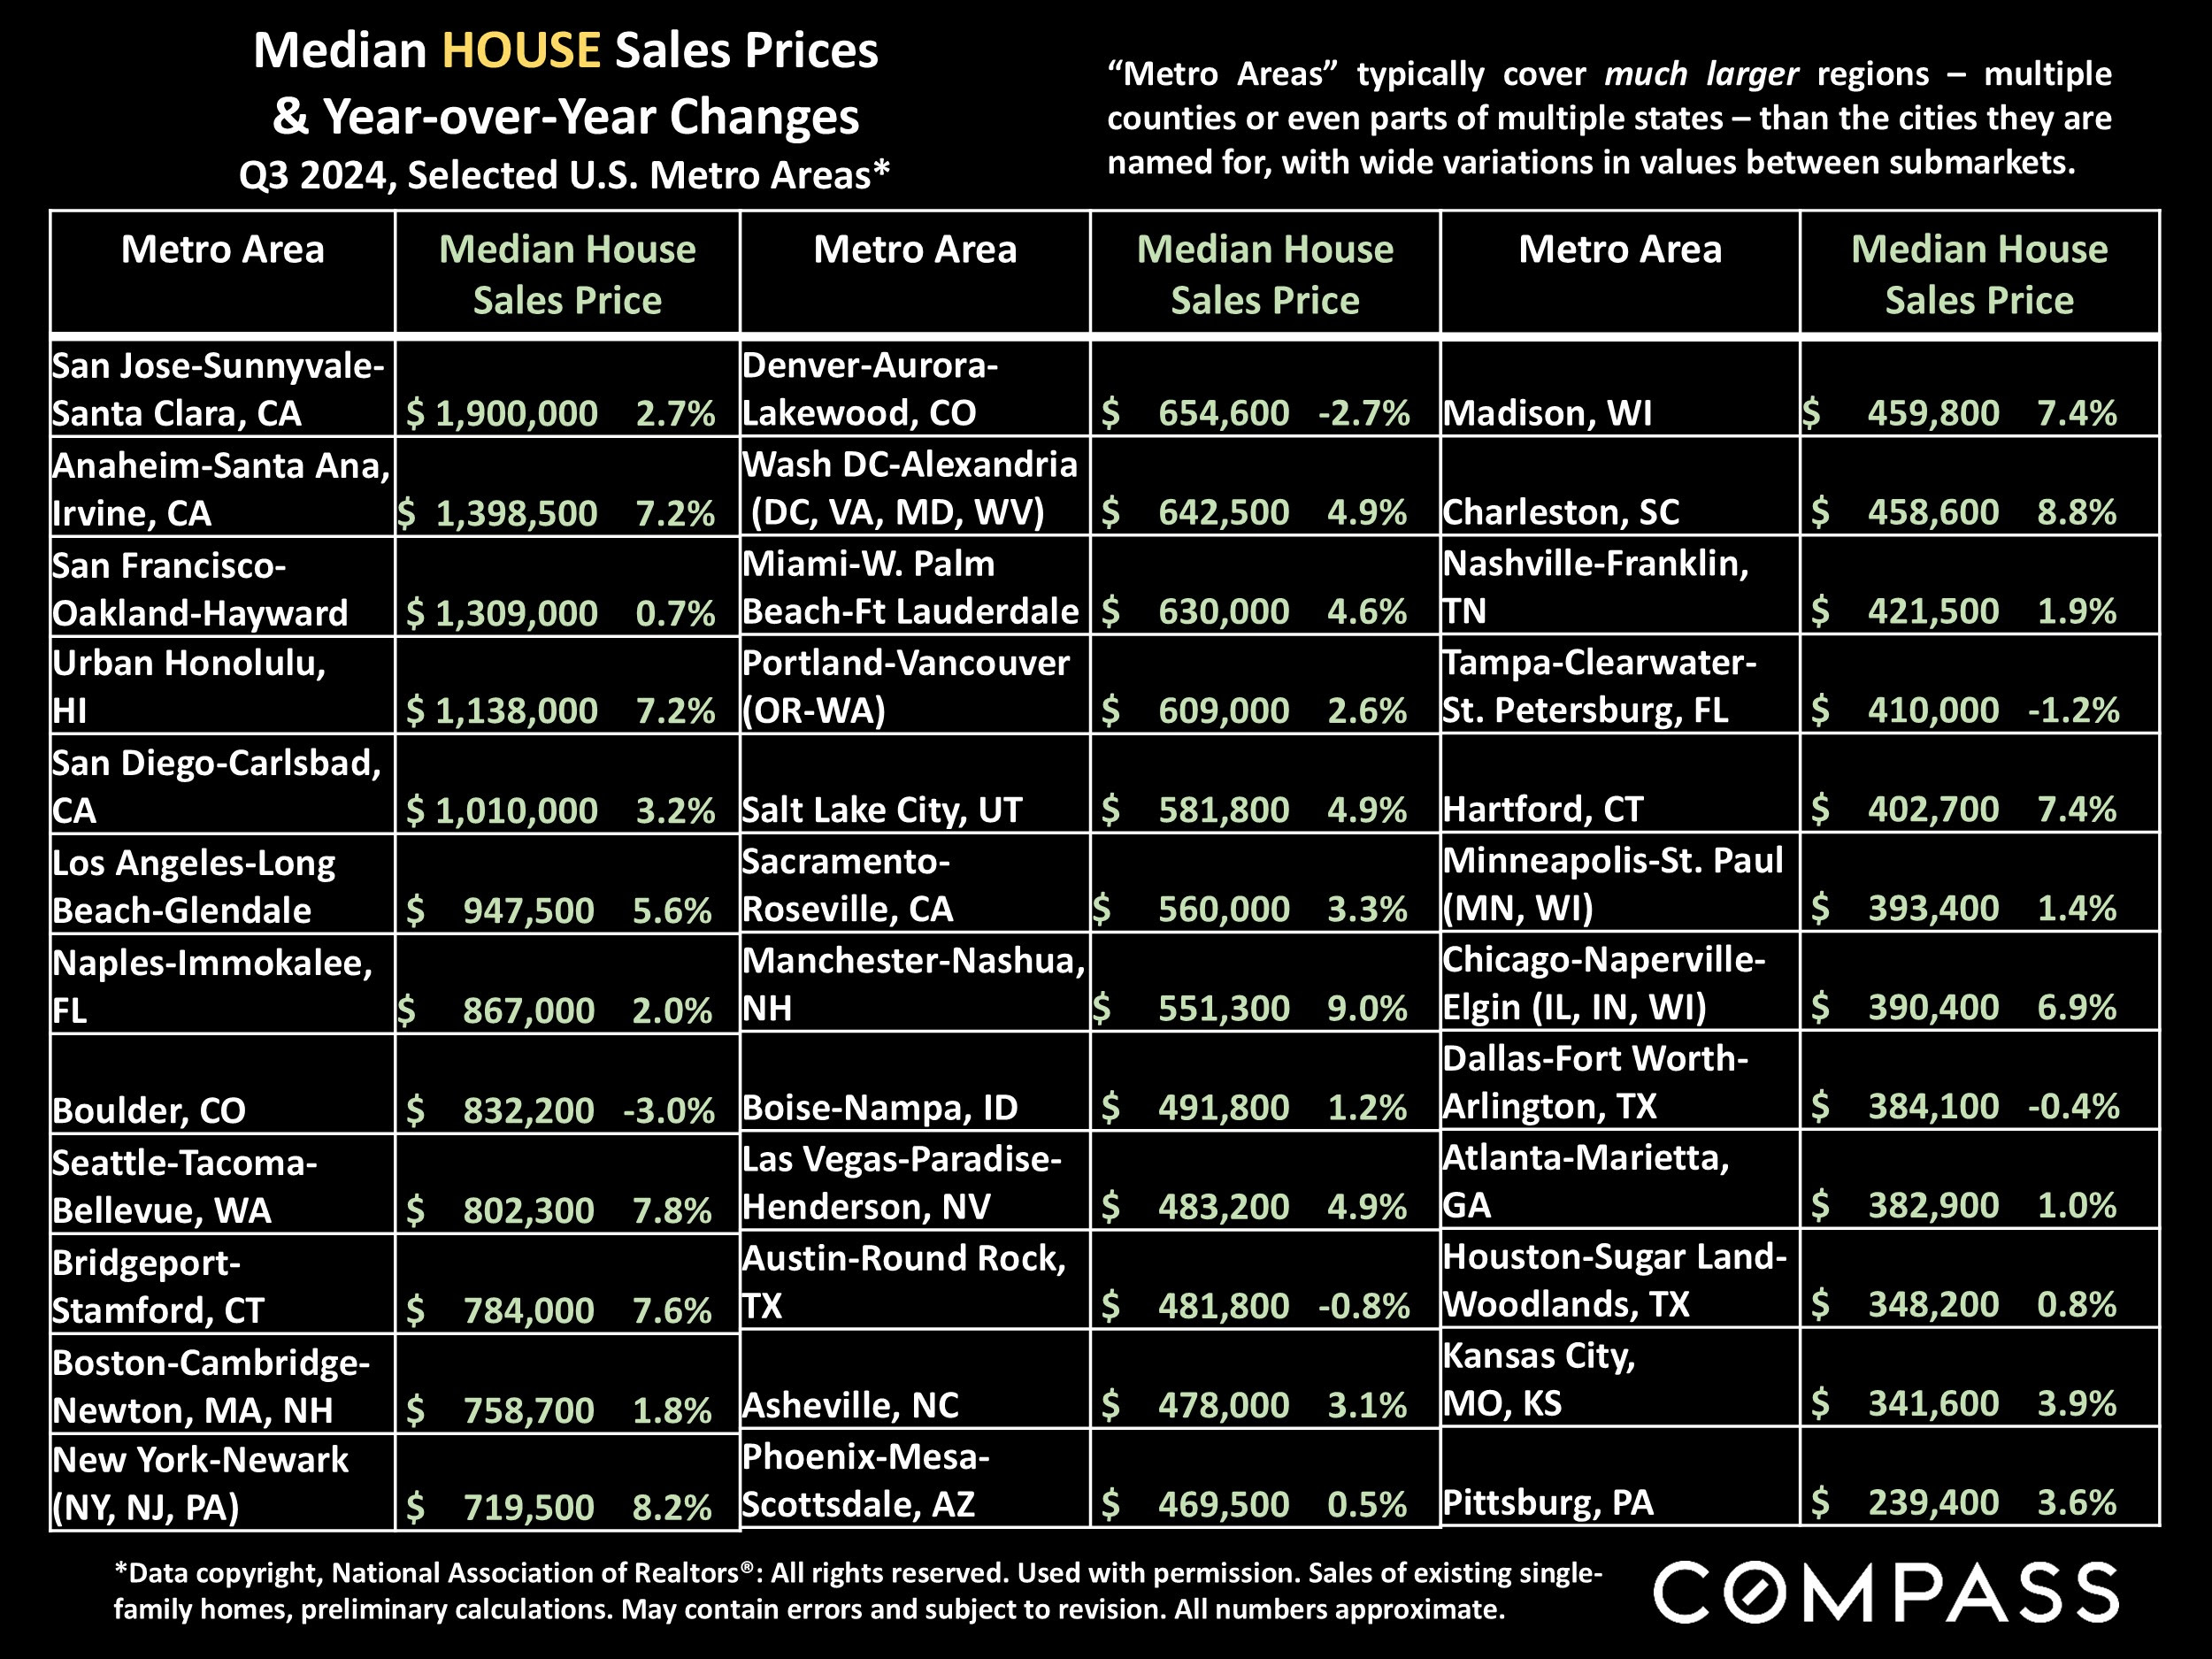
Comparing Q3 2024 median house sales prices and year-over-year appreciation rates in selected "metro areas" (typically multi-county regions containing a multitude of different submarkets). The San Jose, CA metro area, home to high-tech firms such as Nvidia, has seen super-heated conditions due to its "AI boom."
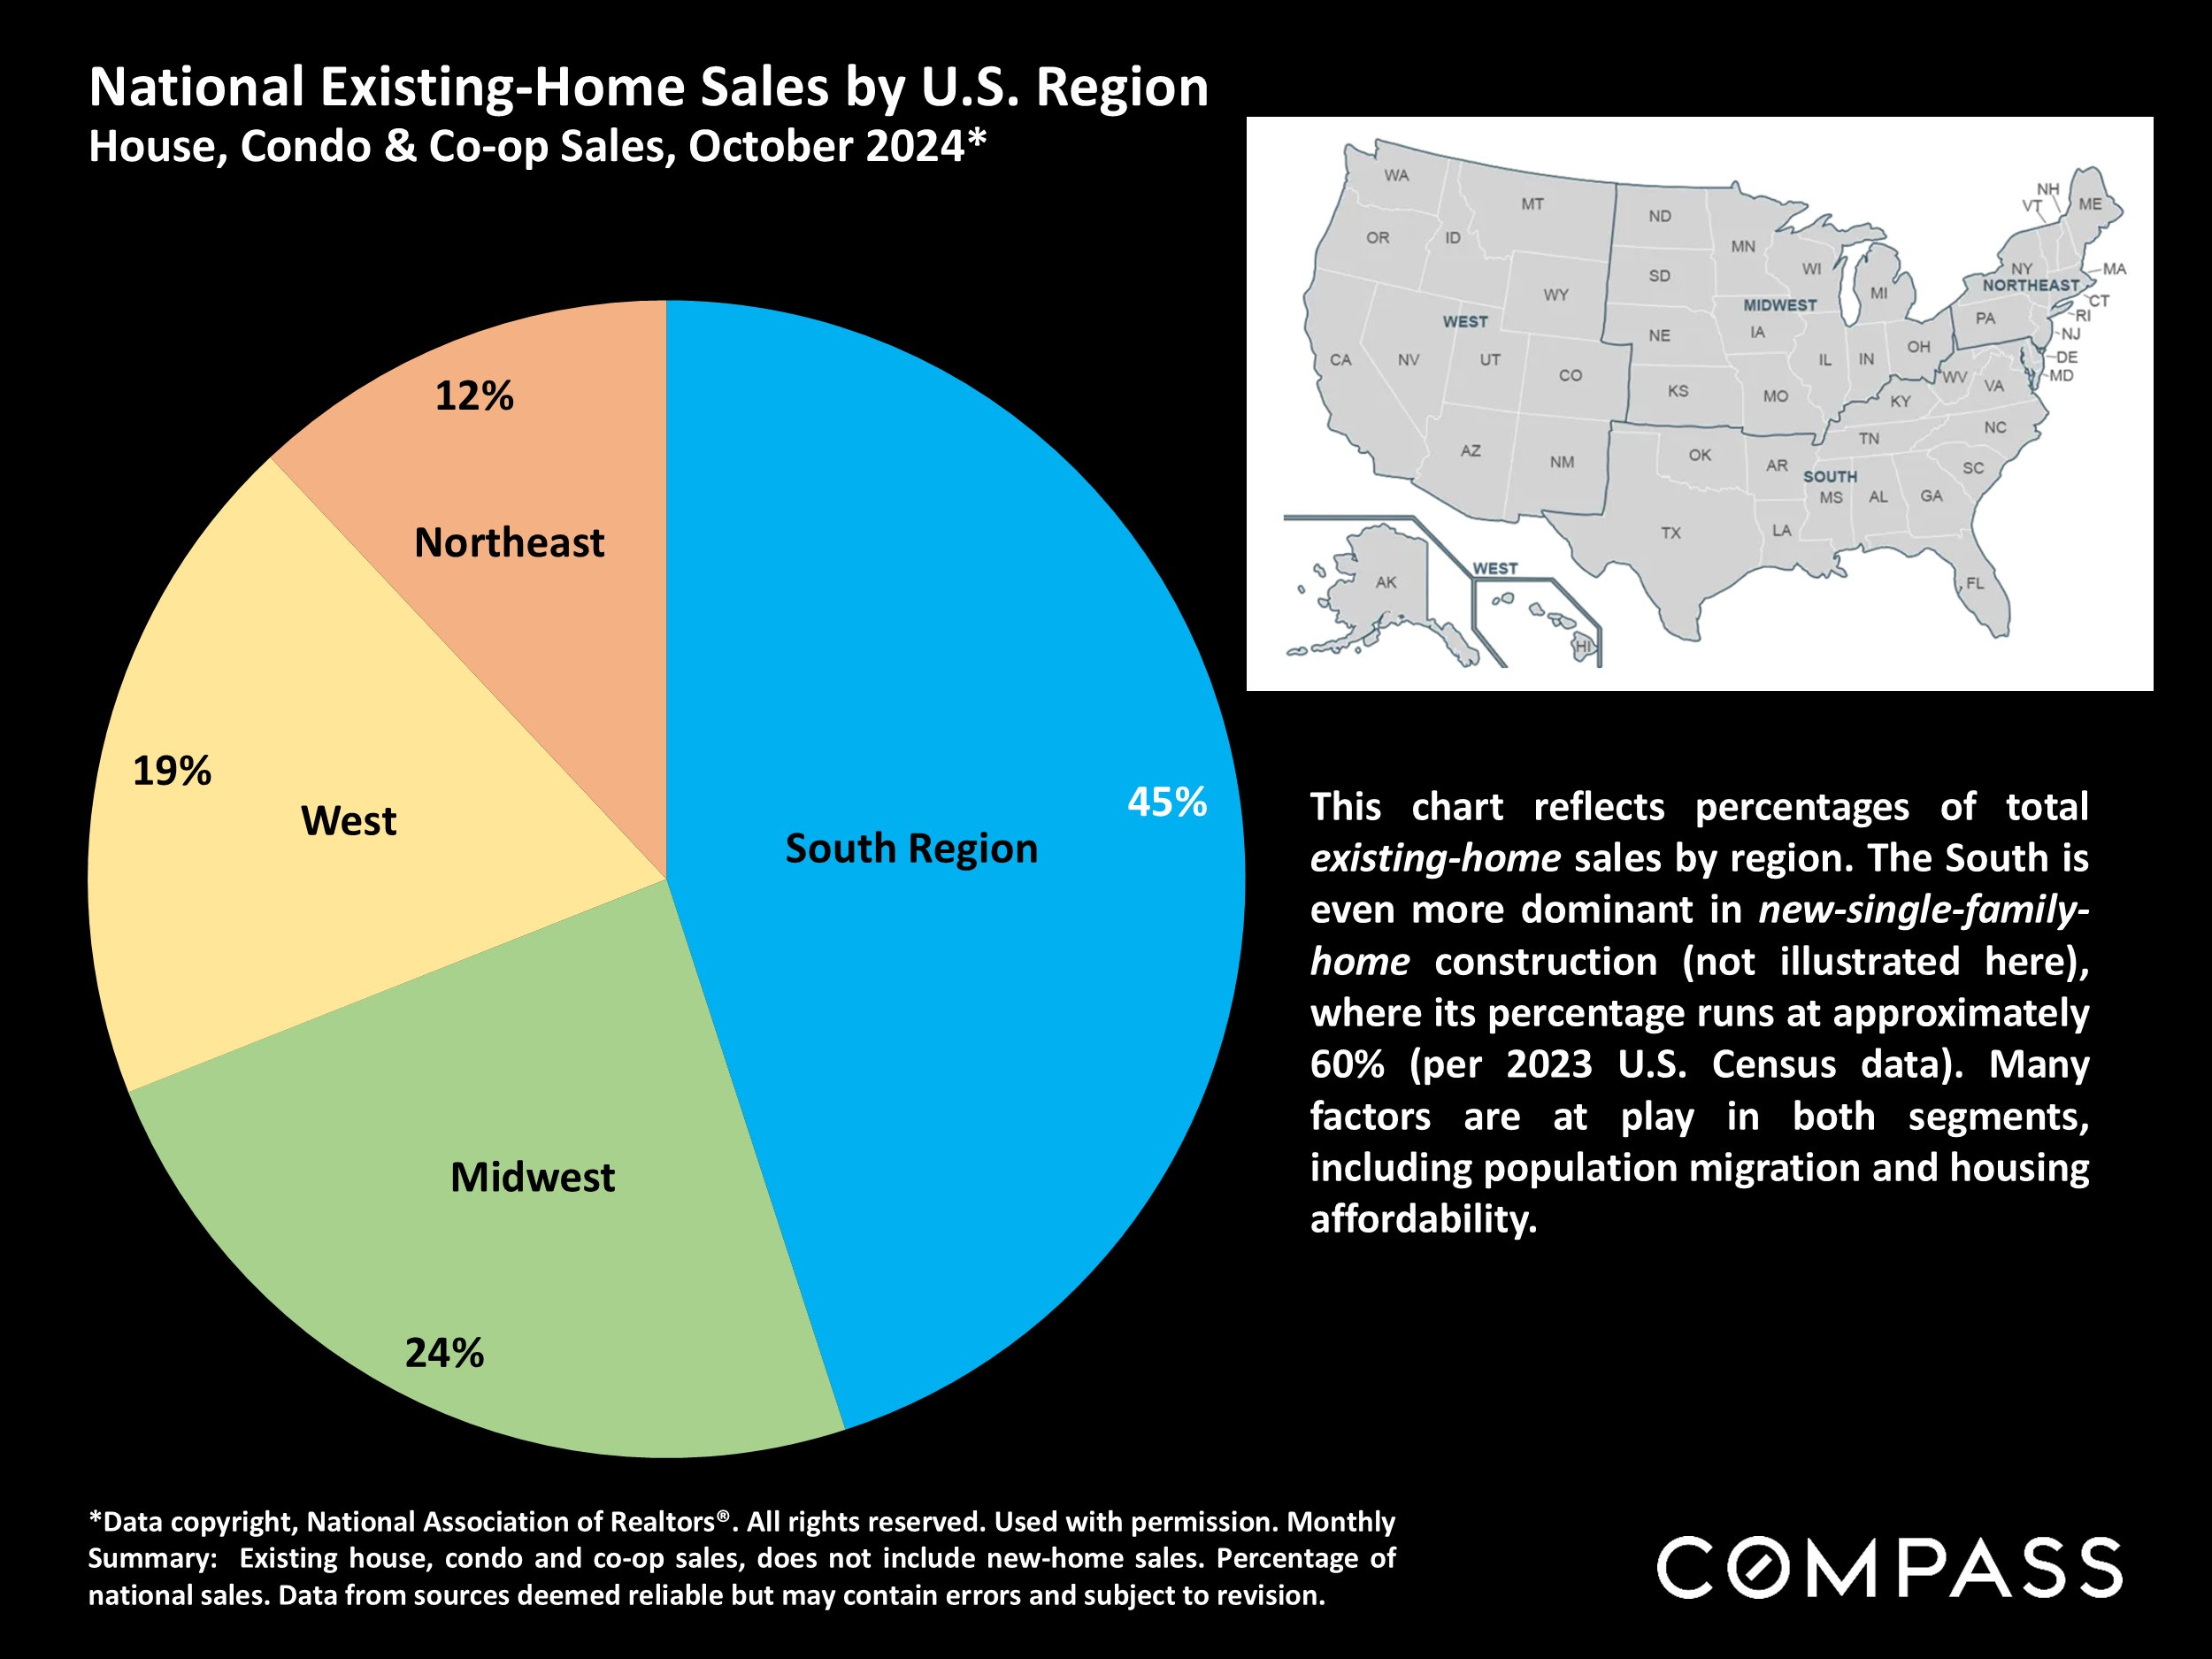
Driven by population growth and relative housing affordability, the South region of the country has the highest sales numbers in the country.
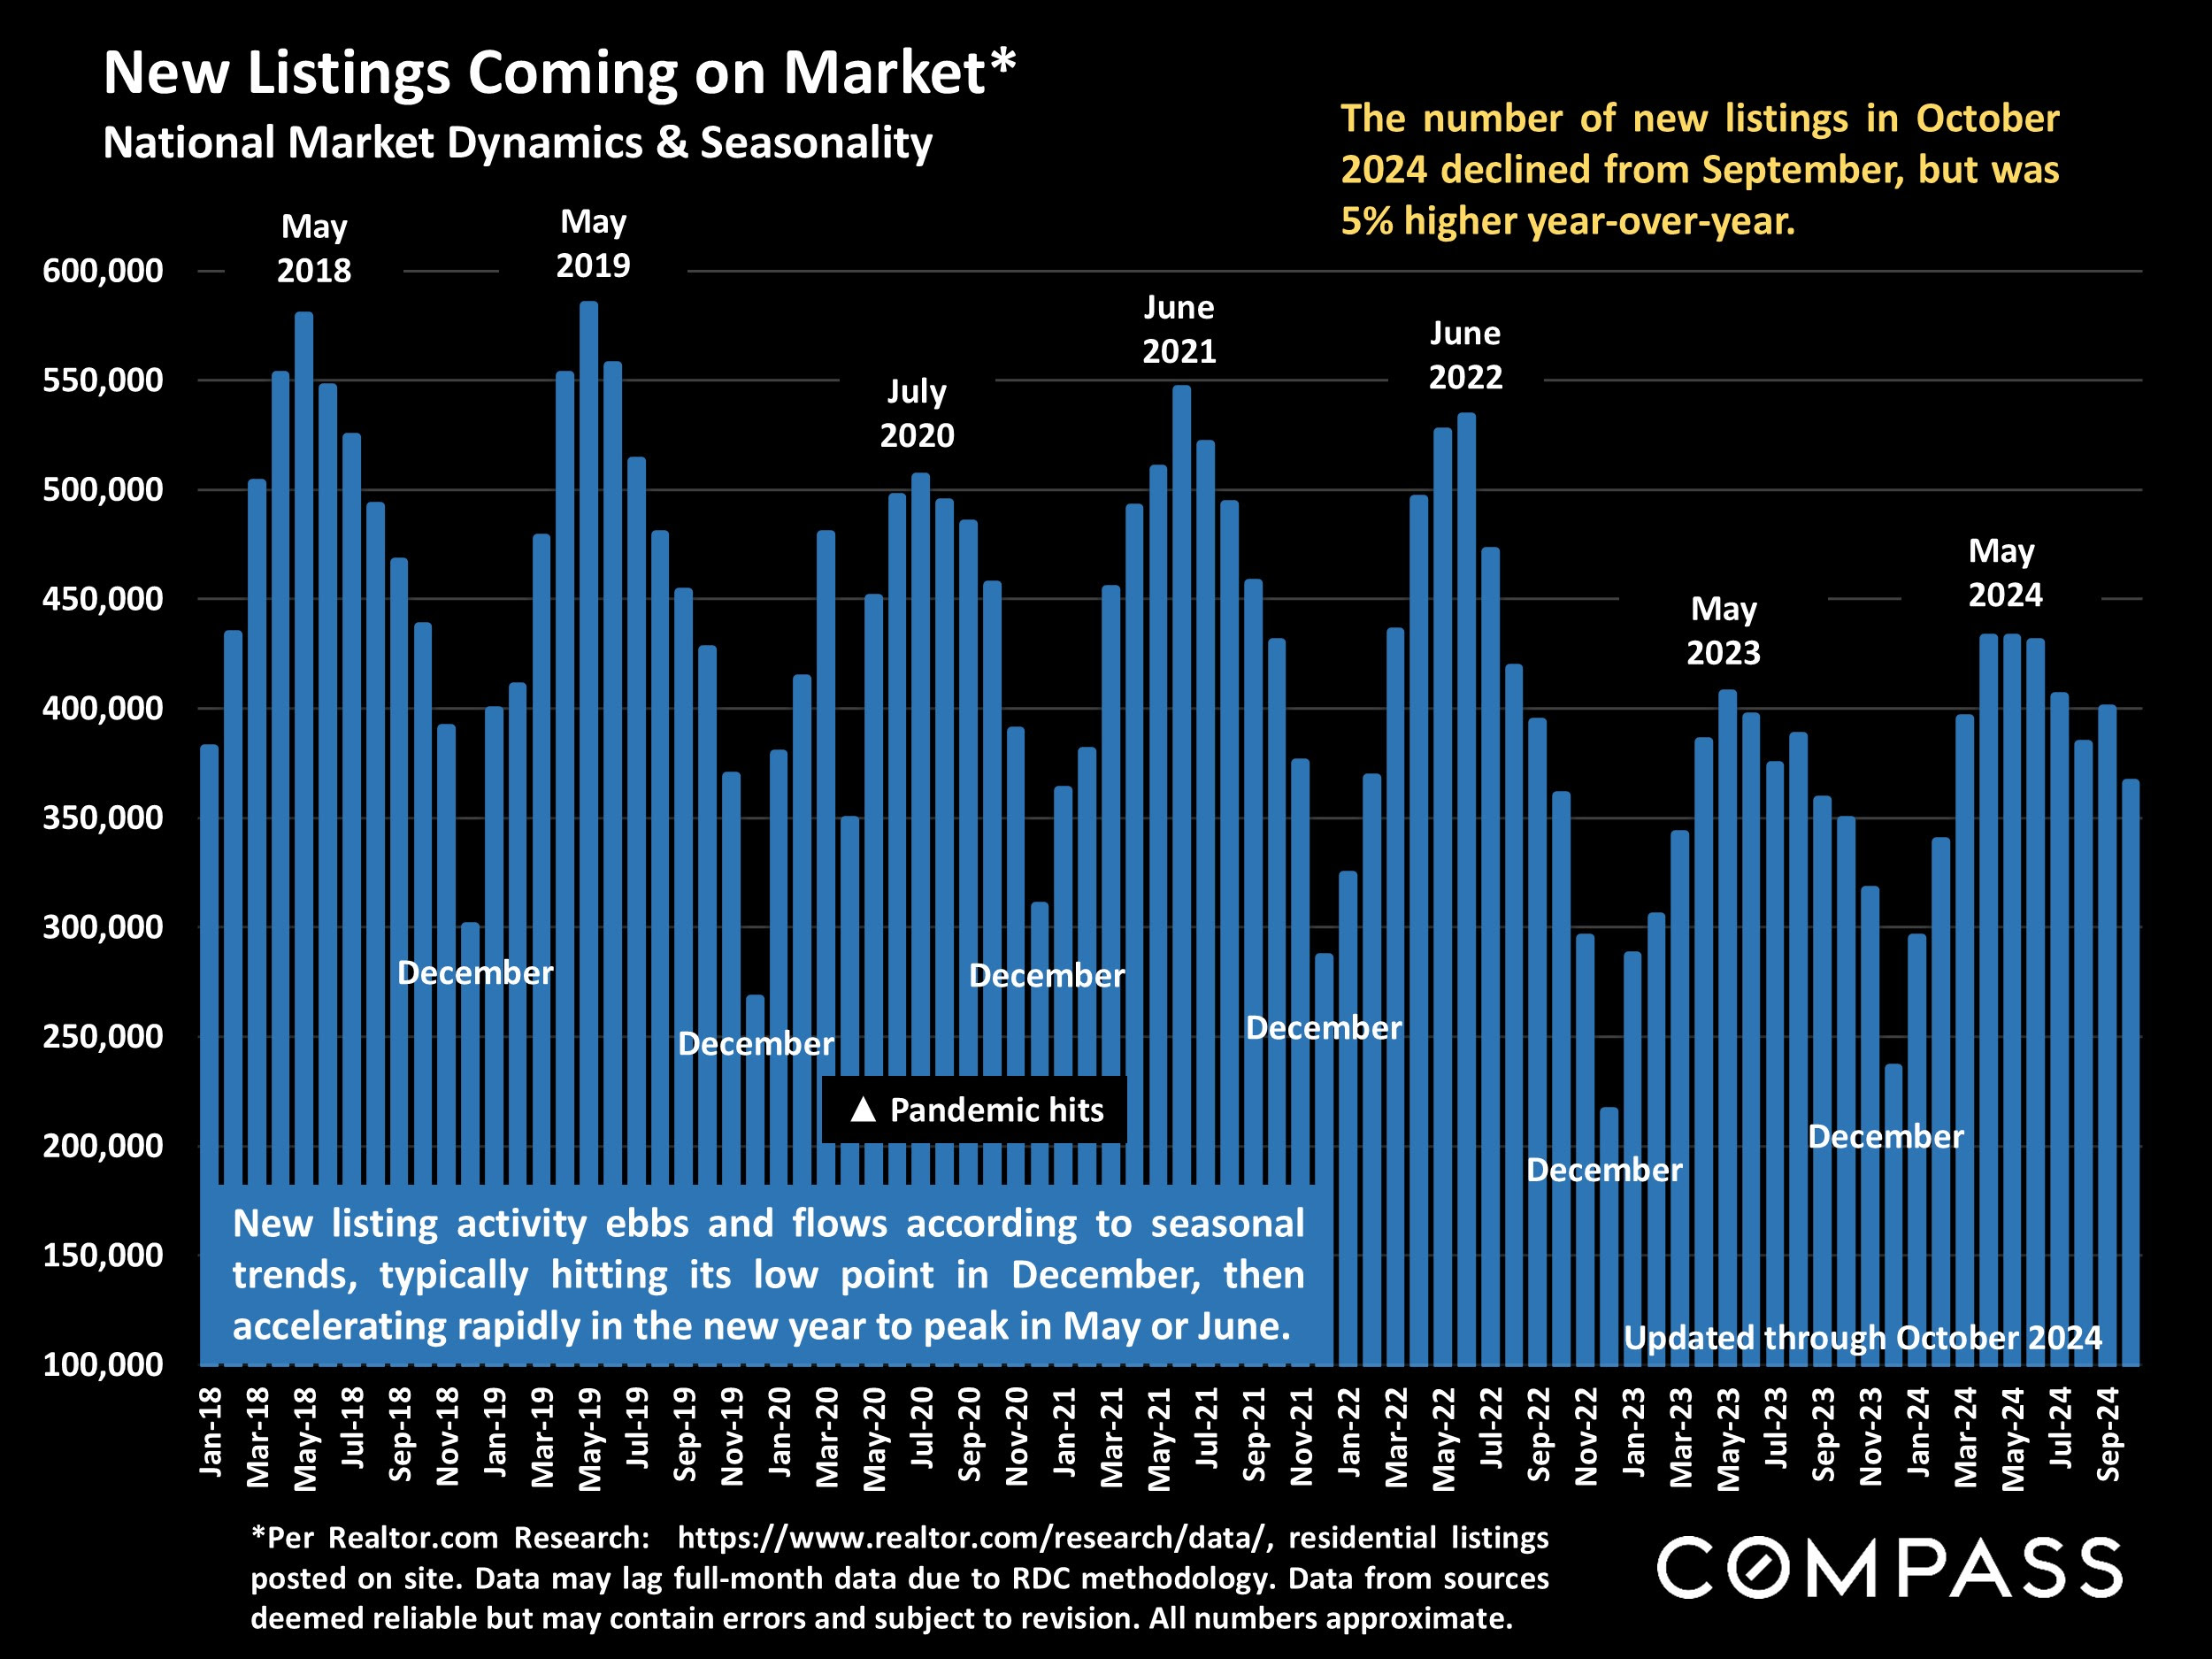
The number of new listings rises and falls dramatically by season, and typically plunges in November and December before picking up again in the new year. 2024 new-listing activity rose from 2023, but remained well below long-term norms.
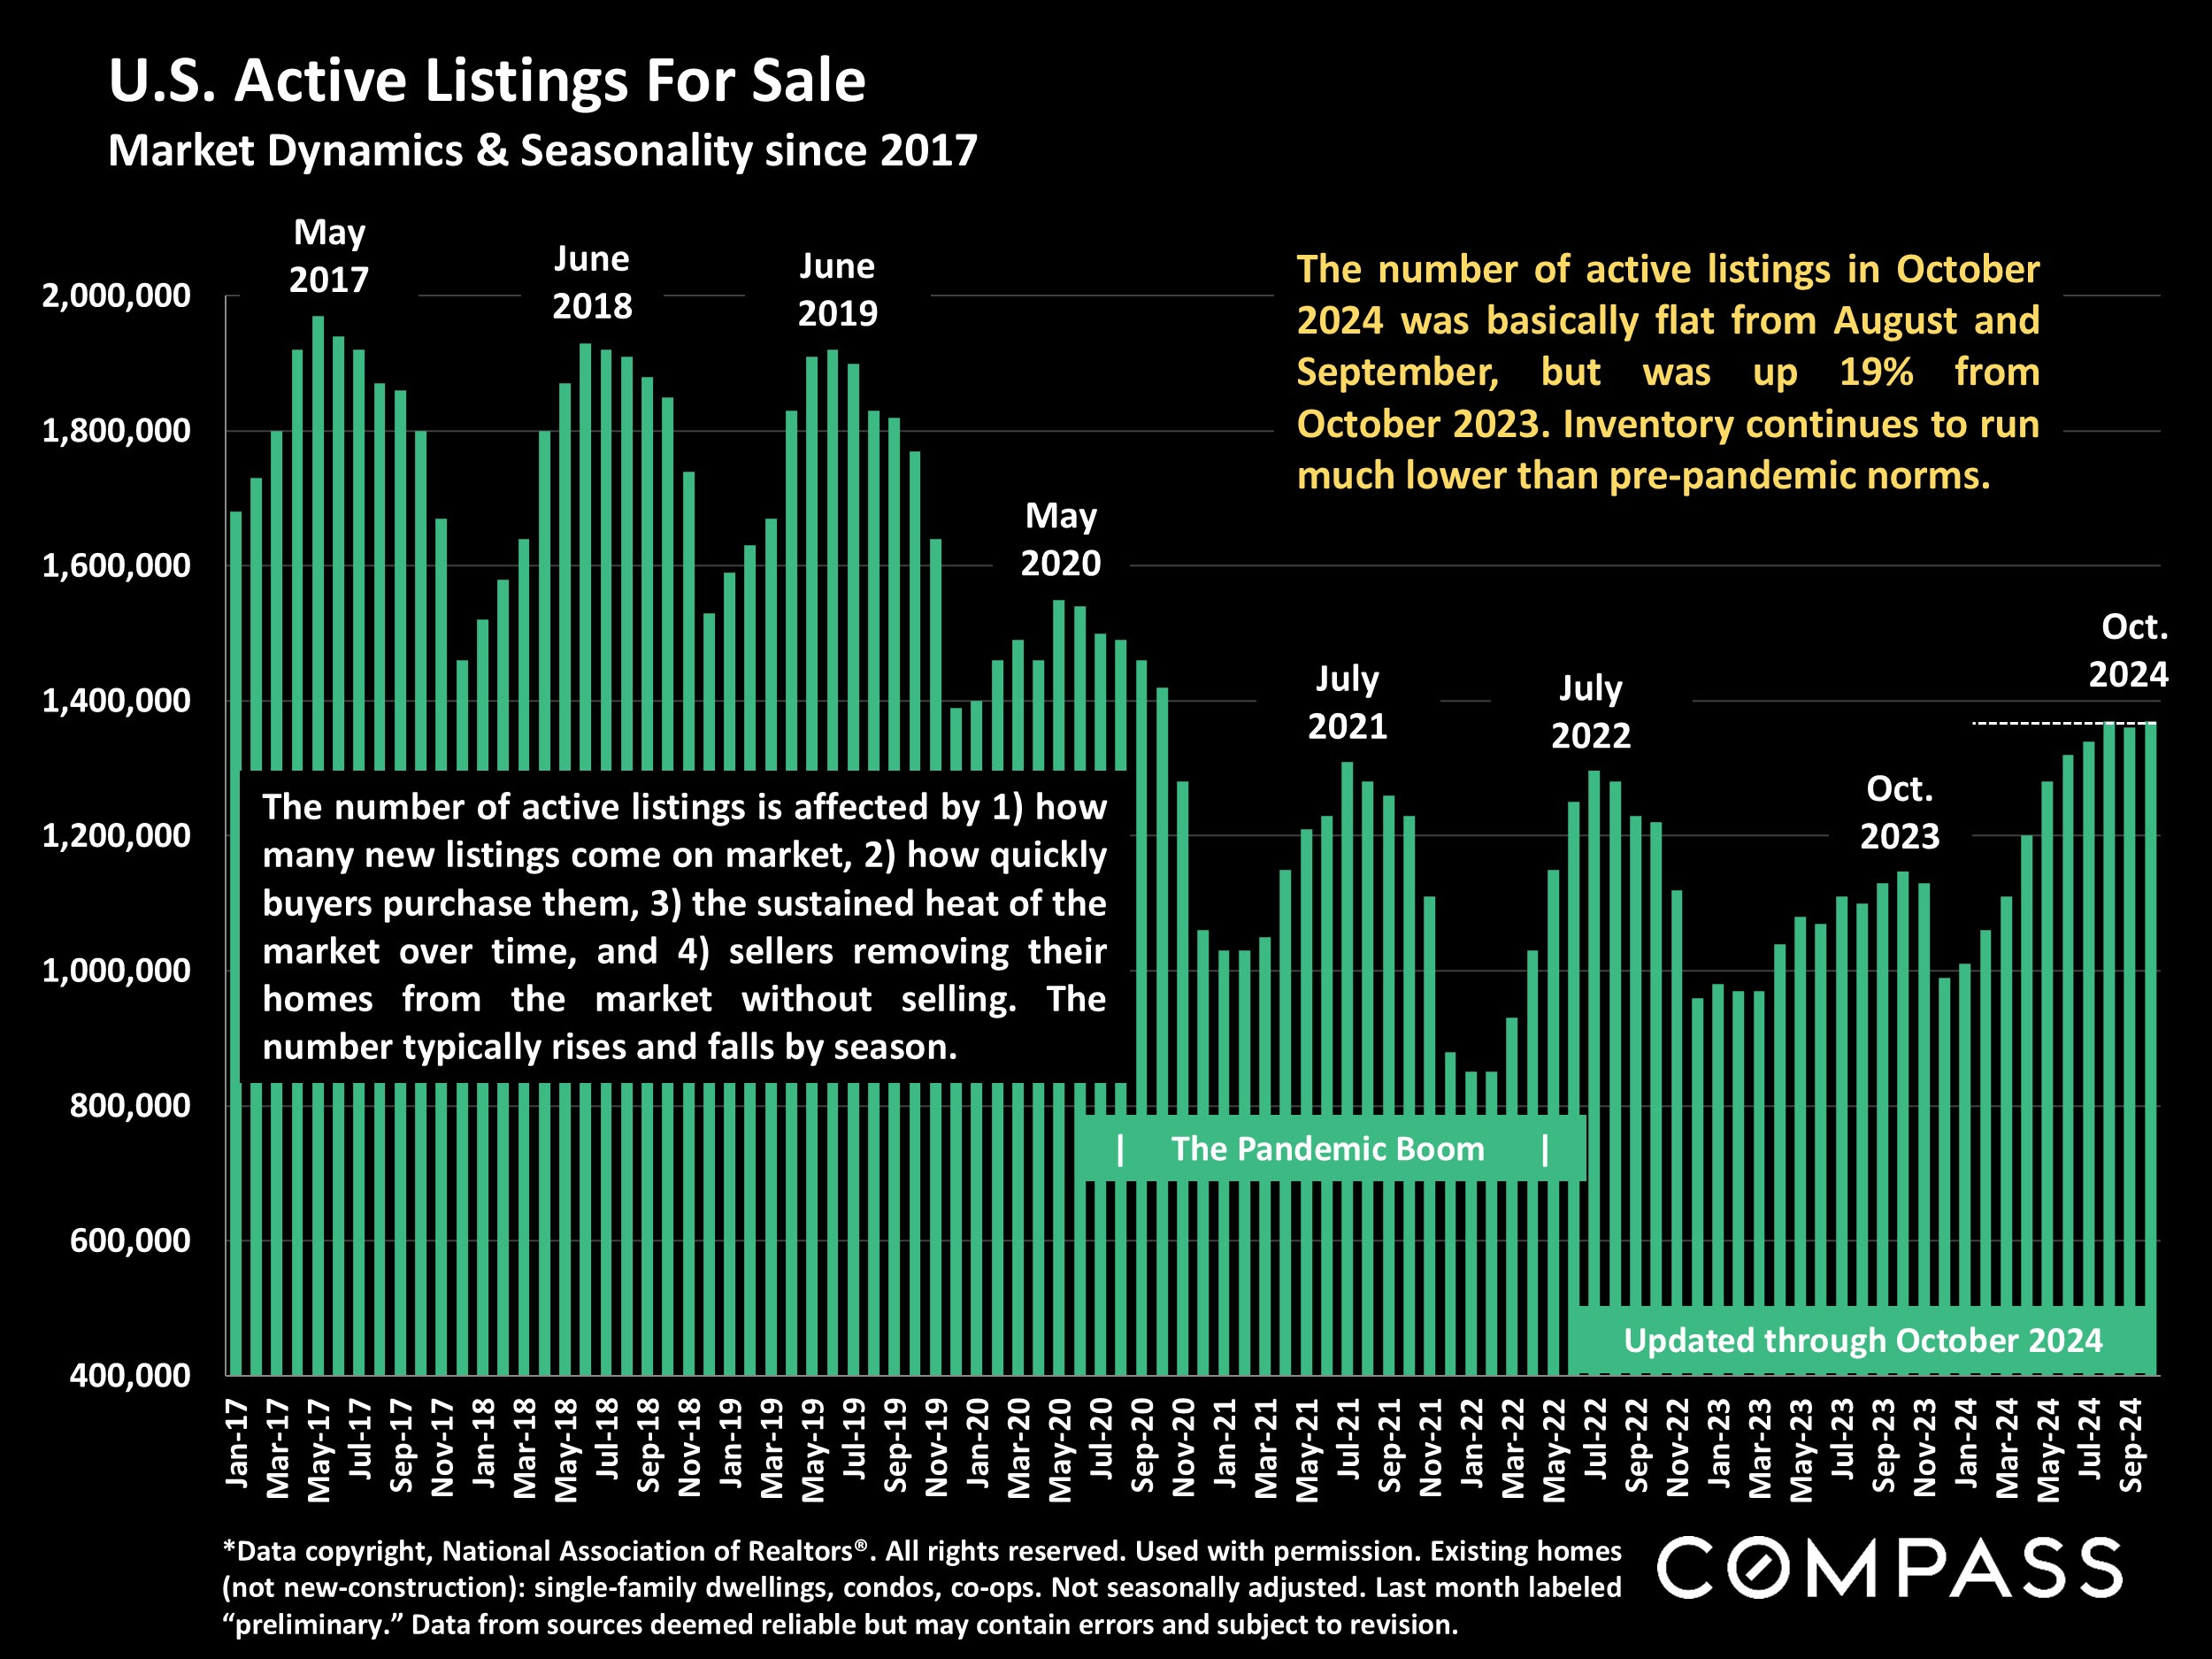
The number of existing (resale) homes for sale is running at its highest count in 4 years, but still much lower than pre-pandemic inventory levels.
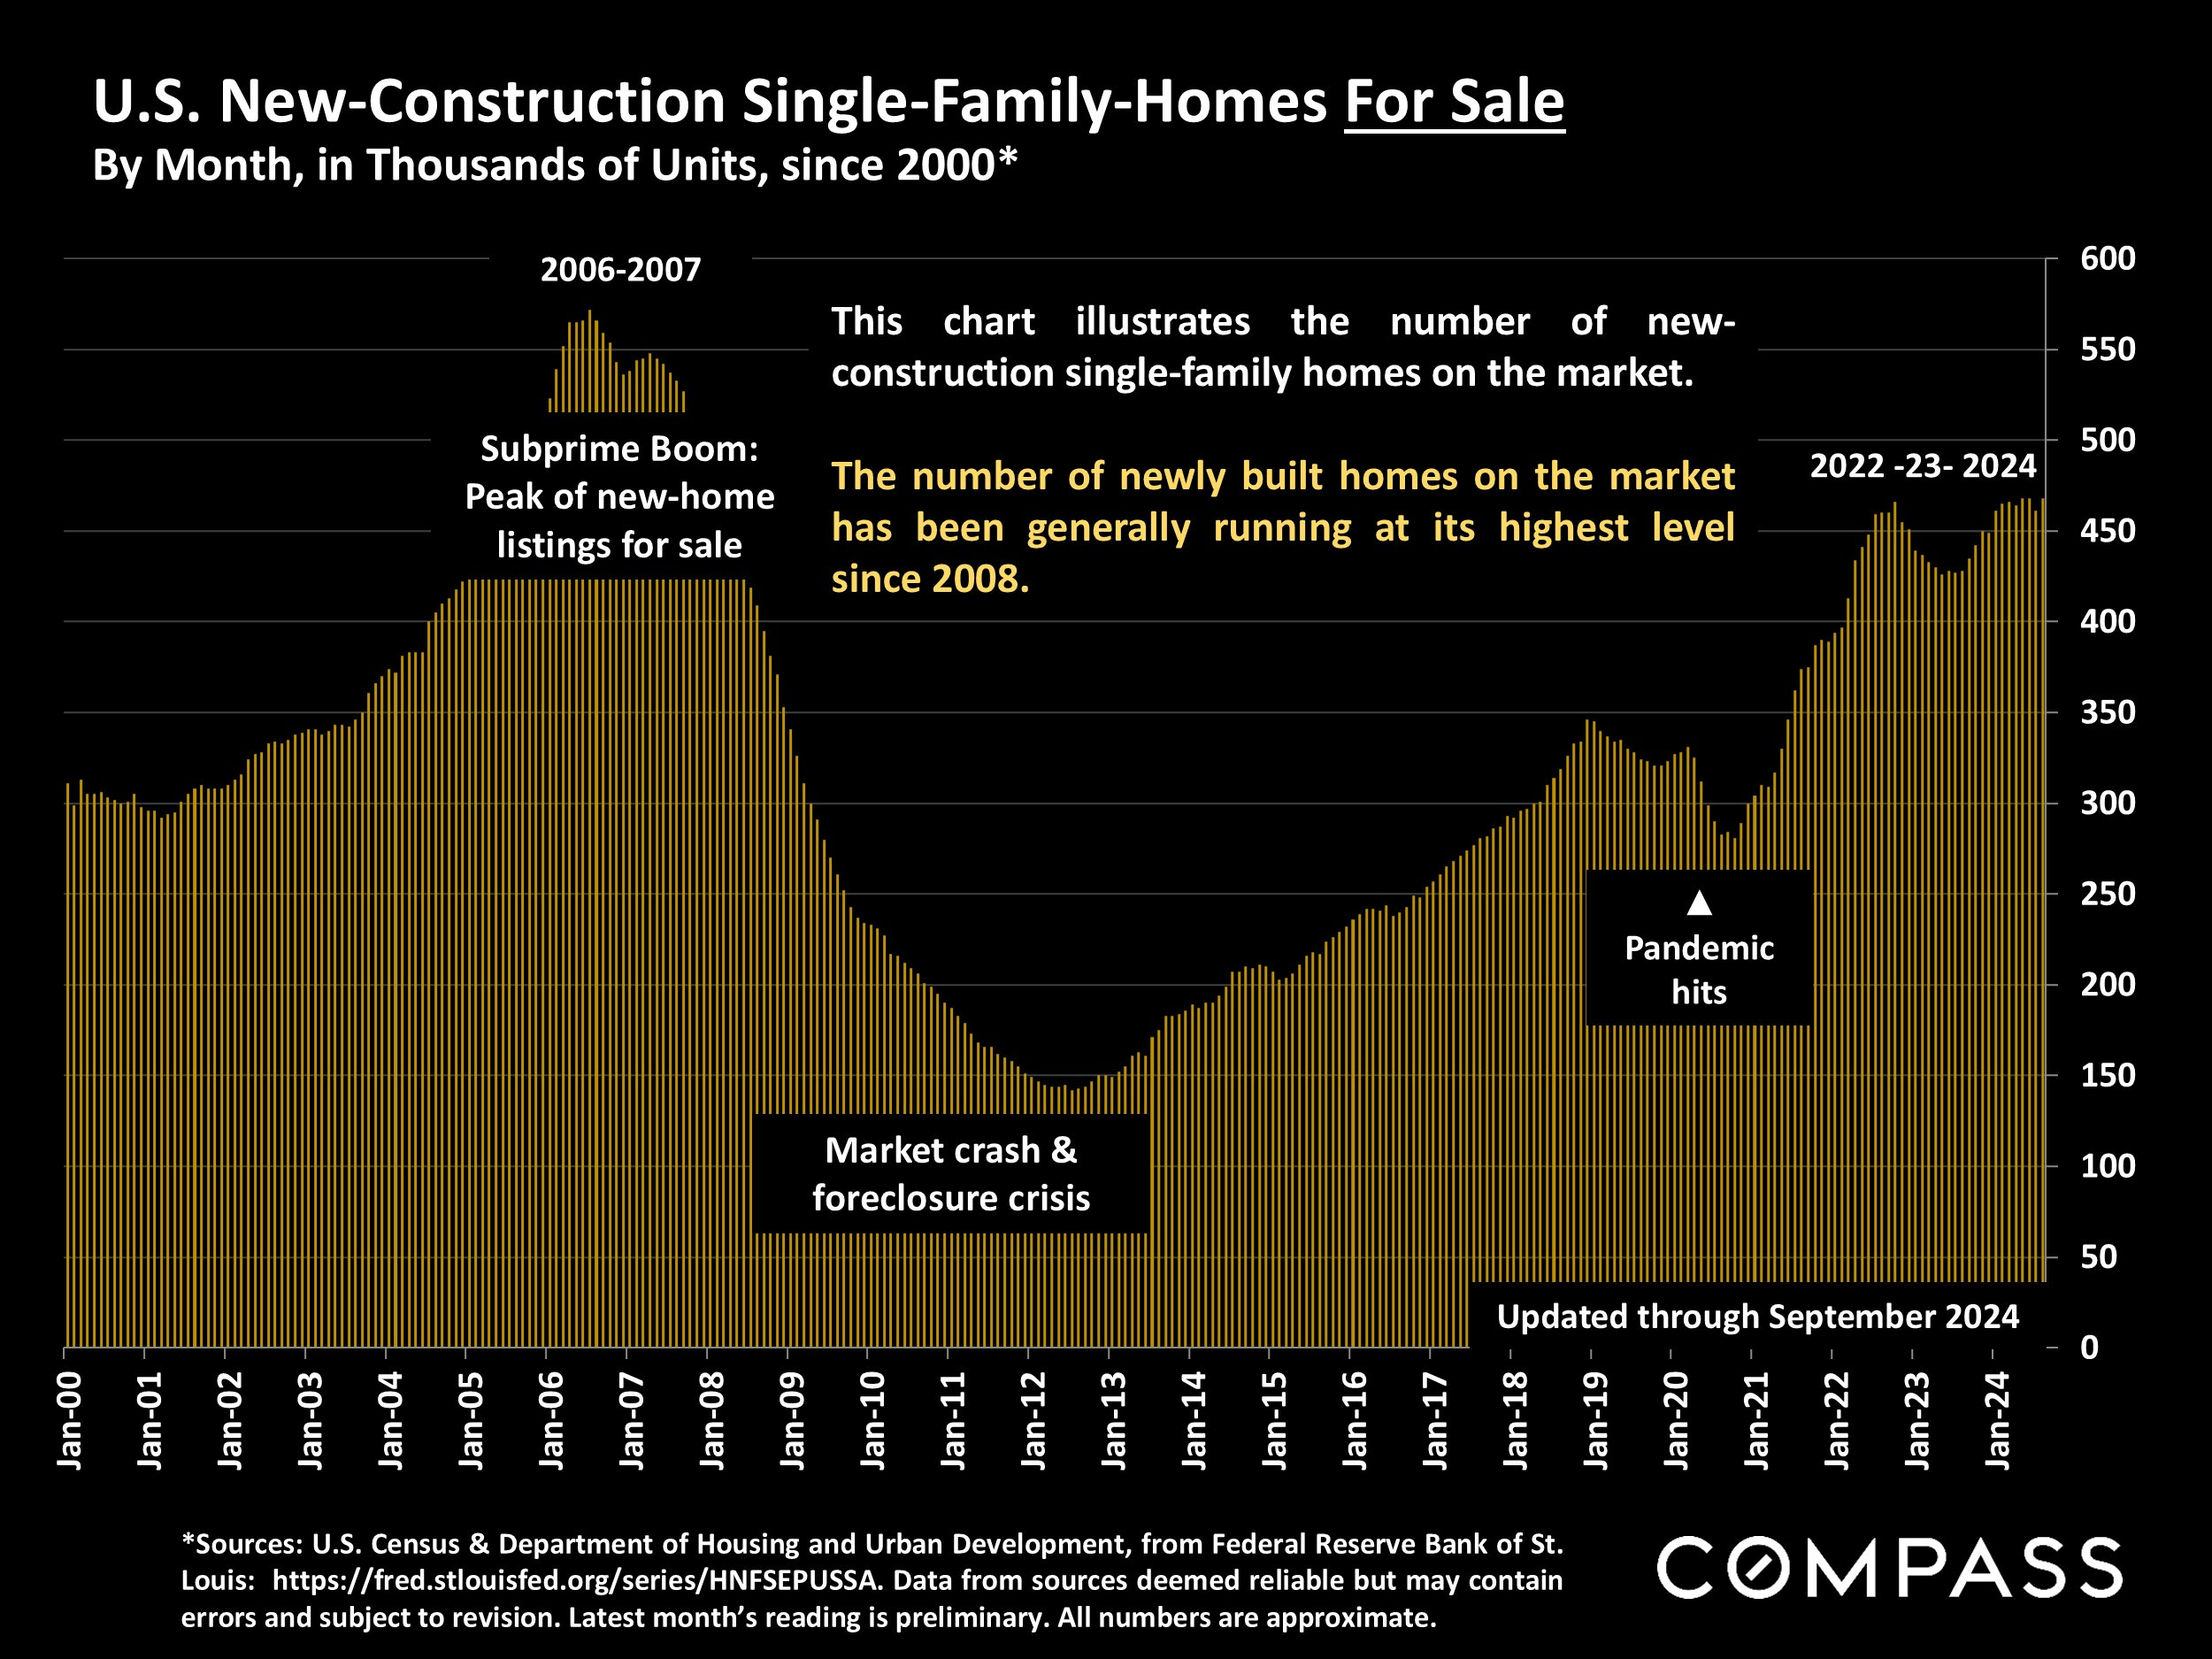
Builders first tried to take advantage of soaring demand during the pandemic boom. They kept building to fill the deficiency of homes for sale after interest rates jumped in 2022 and resale listings plunged due to the "mortgage lock-in" effect. The result: The number of new-construction single-family-homes for sale is at its highest point since 2008.
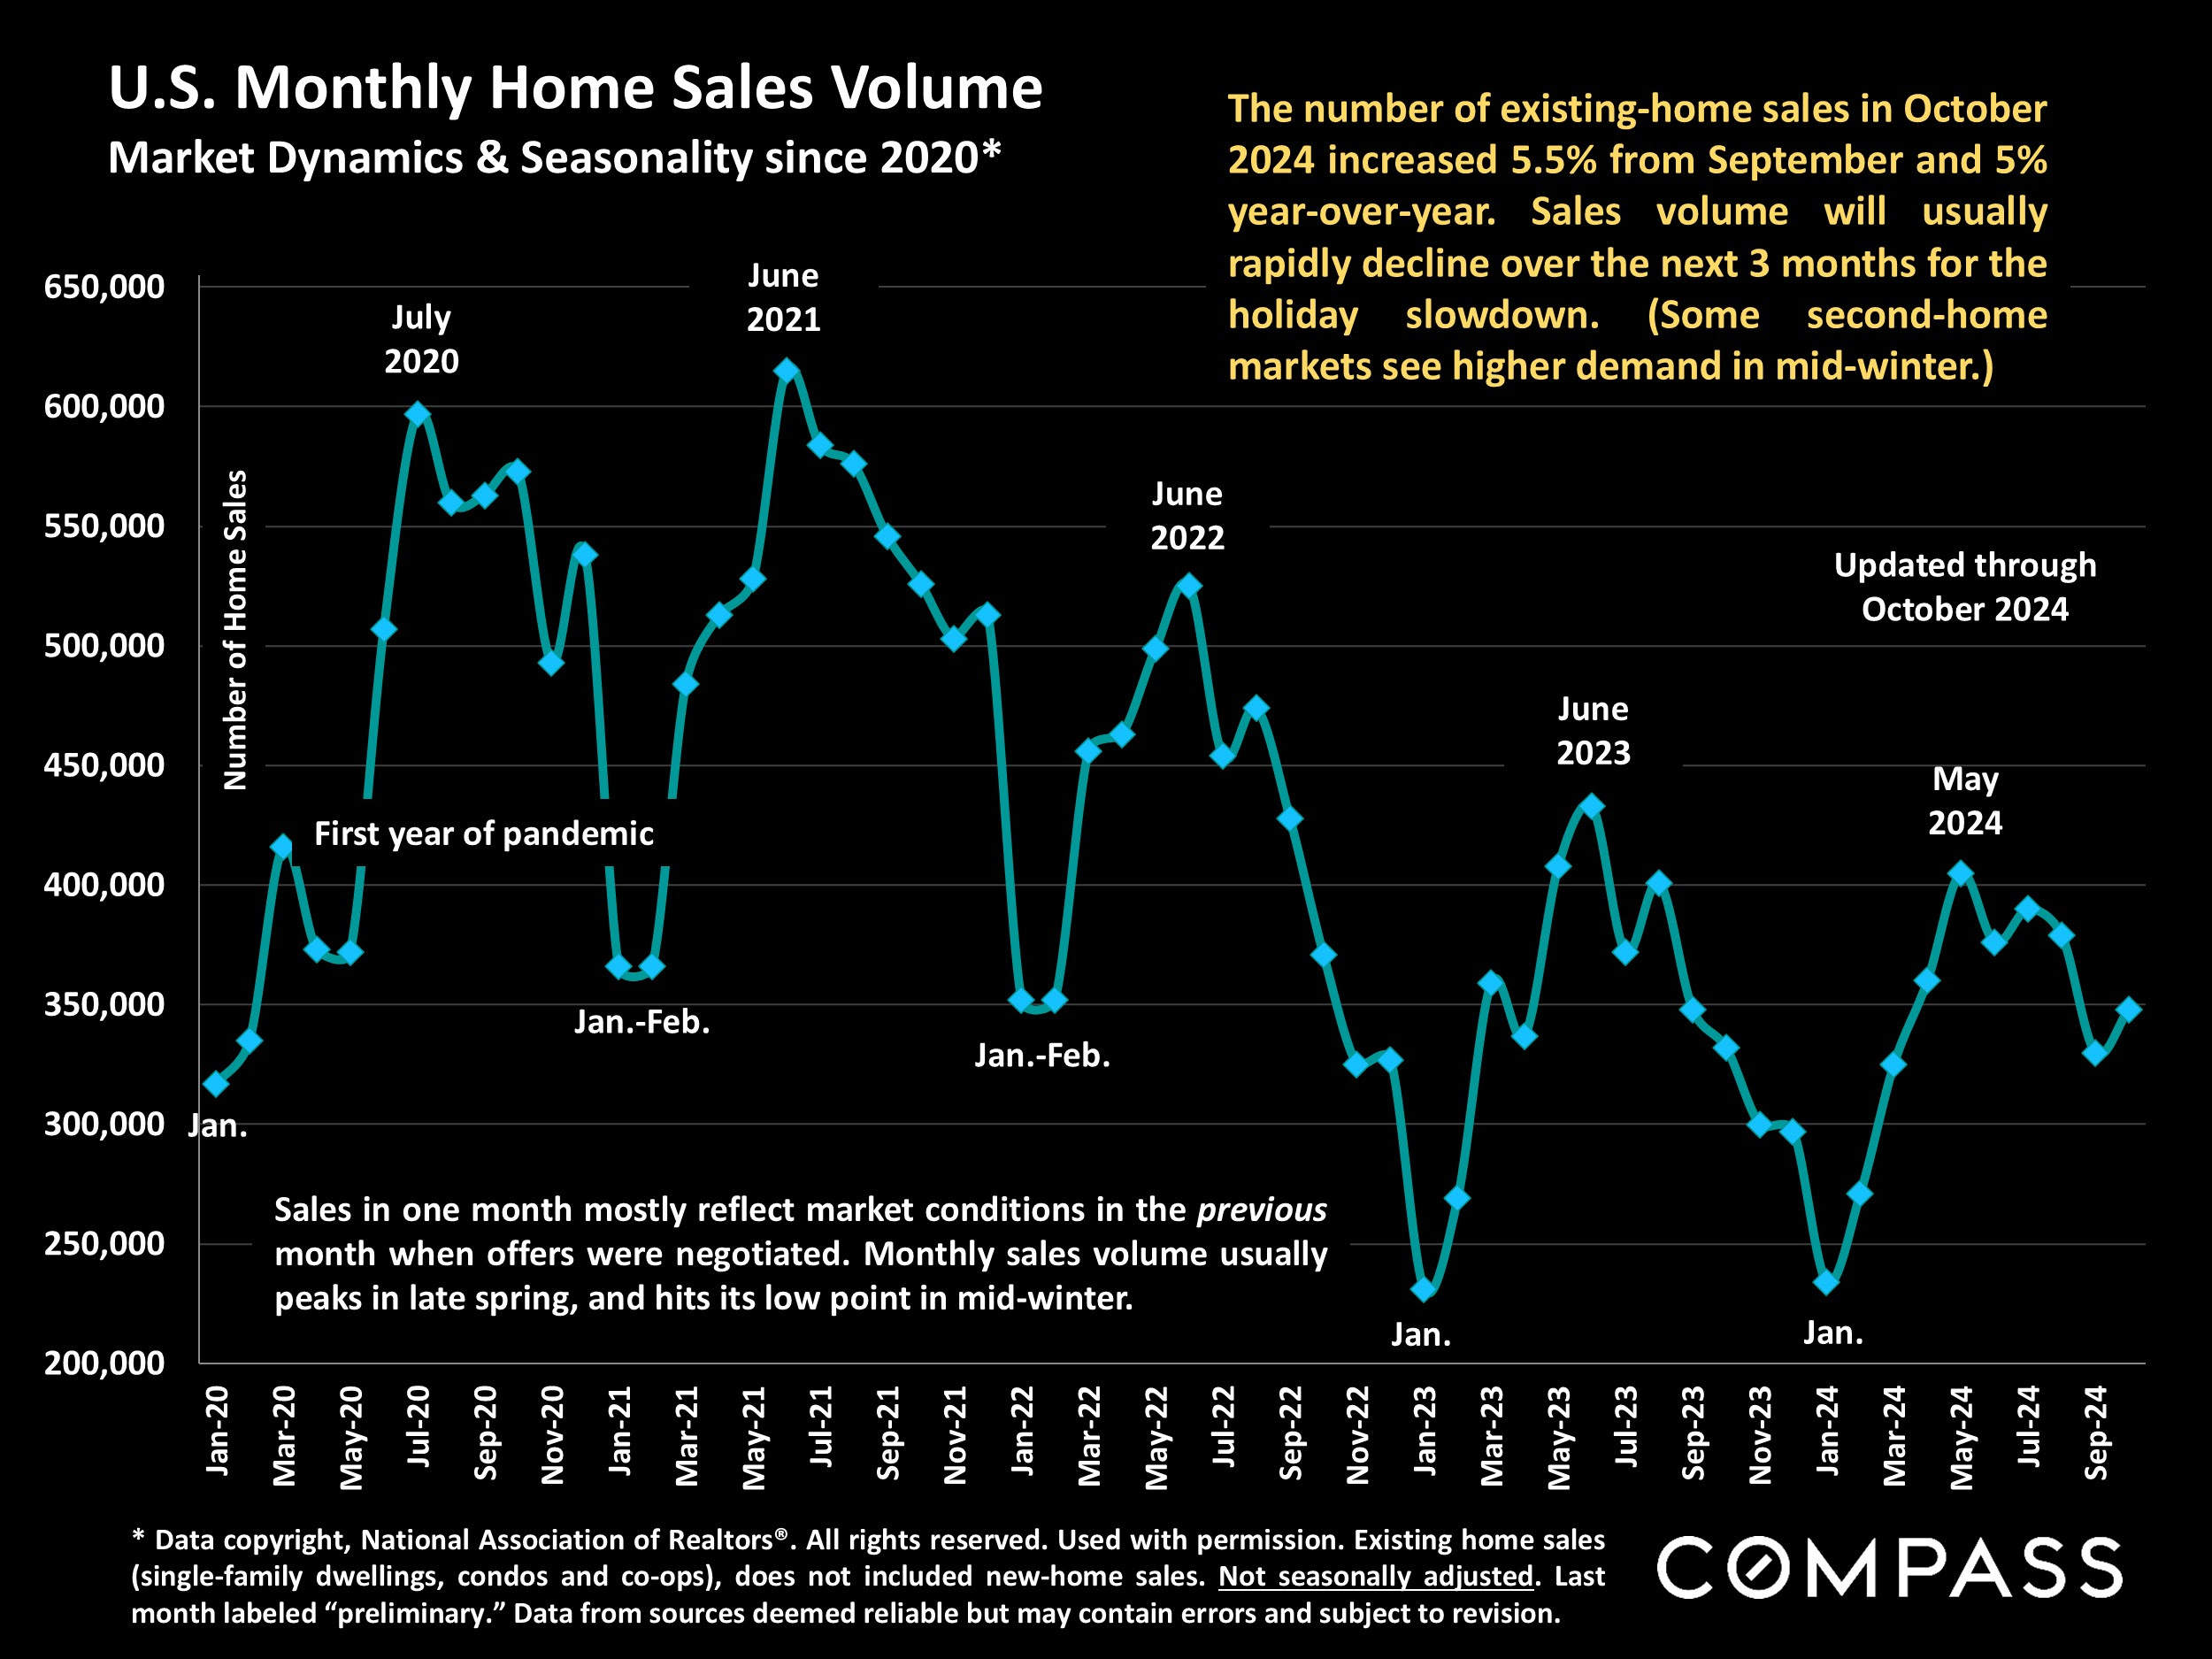
Perhaps due to September's lower interest rates, existing-home sales volume spiked up a bit in October. (Sales in one month mostly reflect listings that went into contract in the previous month.) When November data becomes available, we will see if and how October's rising rates affected sales.
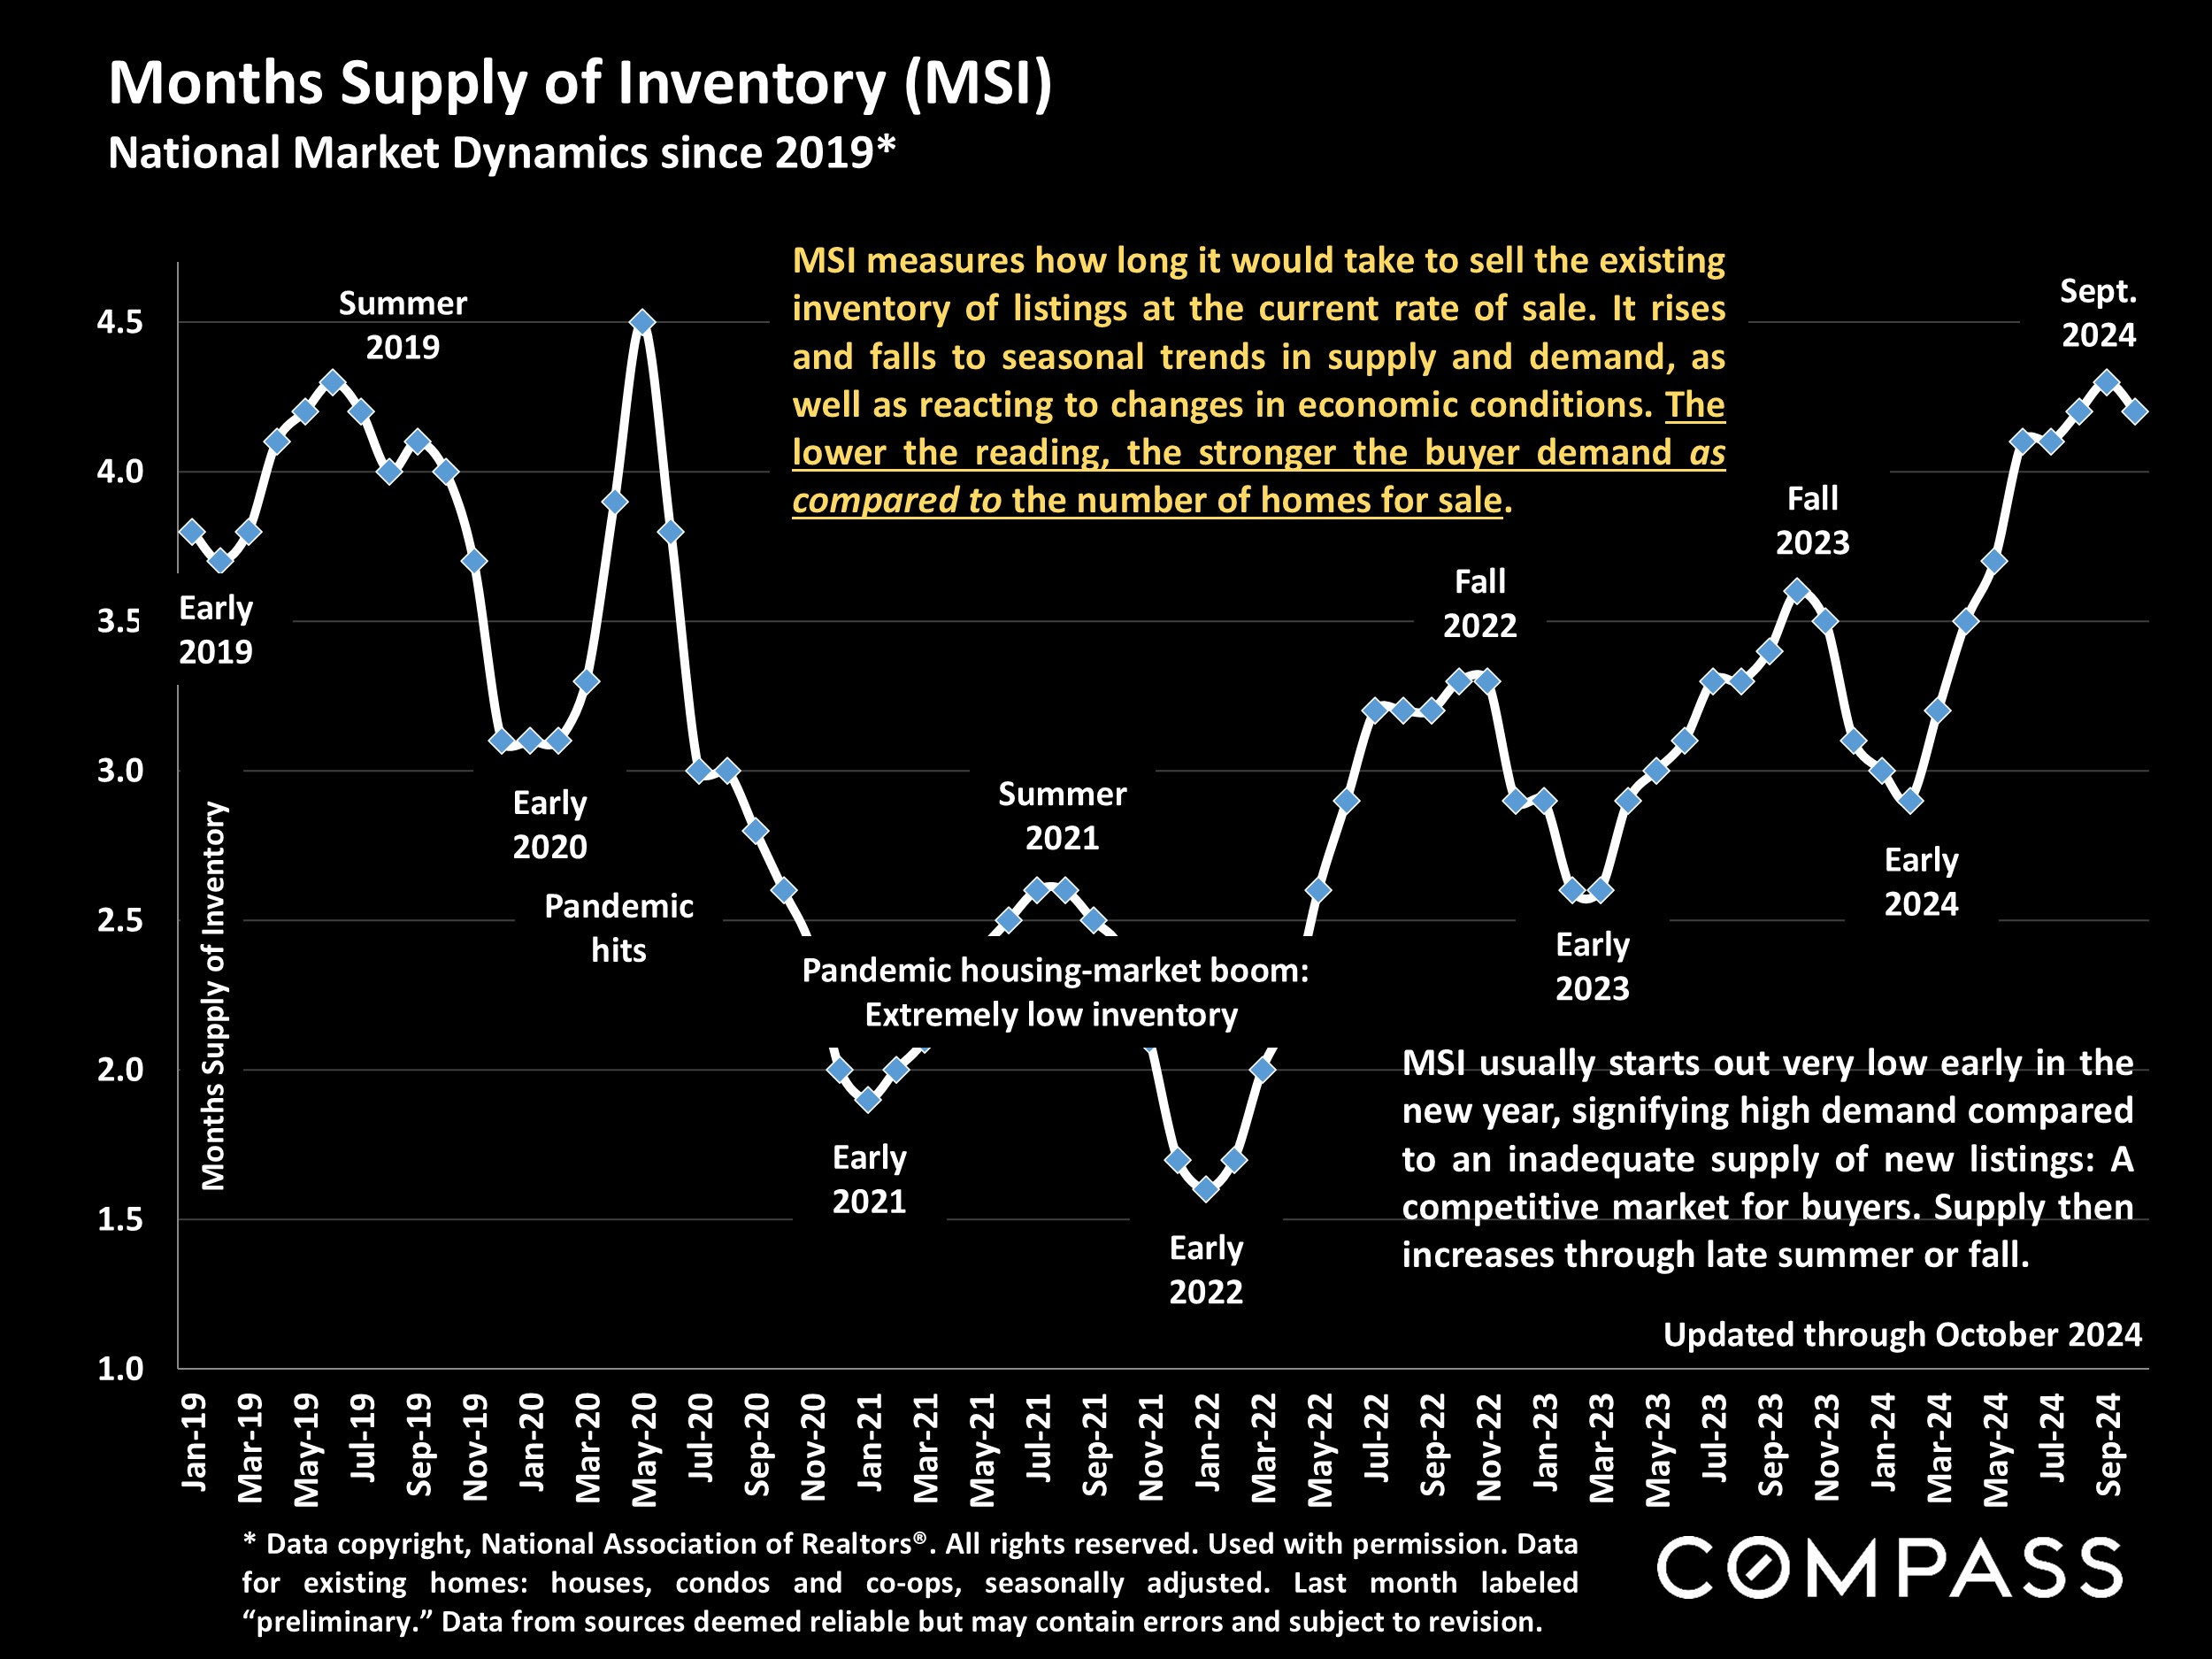
Sales have not kept pace with the increase in listings, which has lifted the months-supply-of-inventory reading to its highest point since 2020. This means buyers have more listings to choose from and comparatively less competition from other buyers.
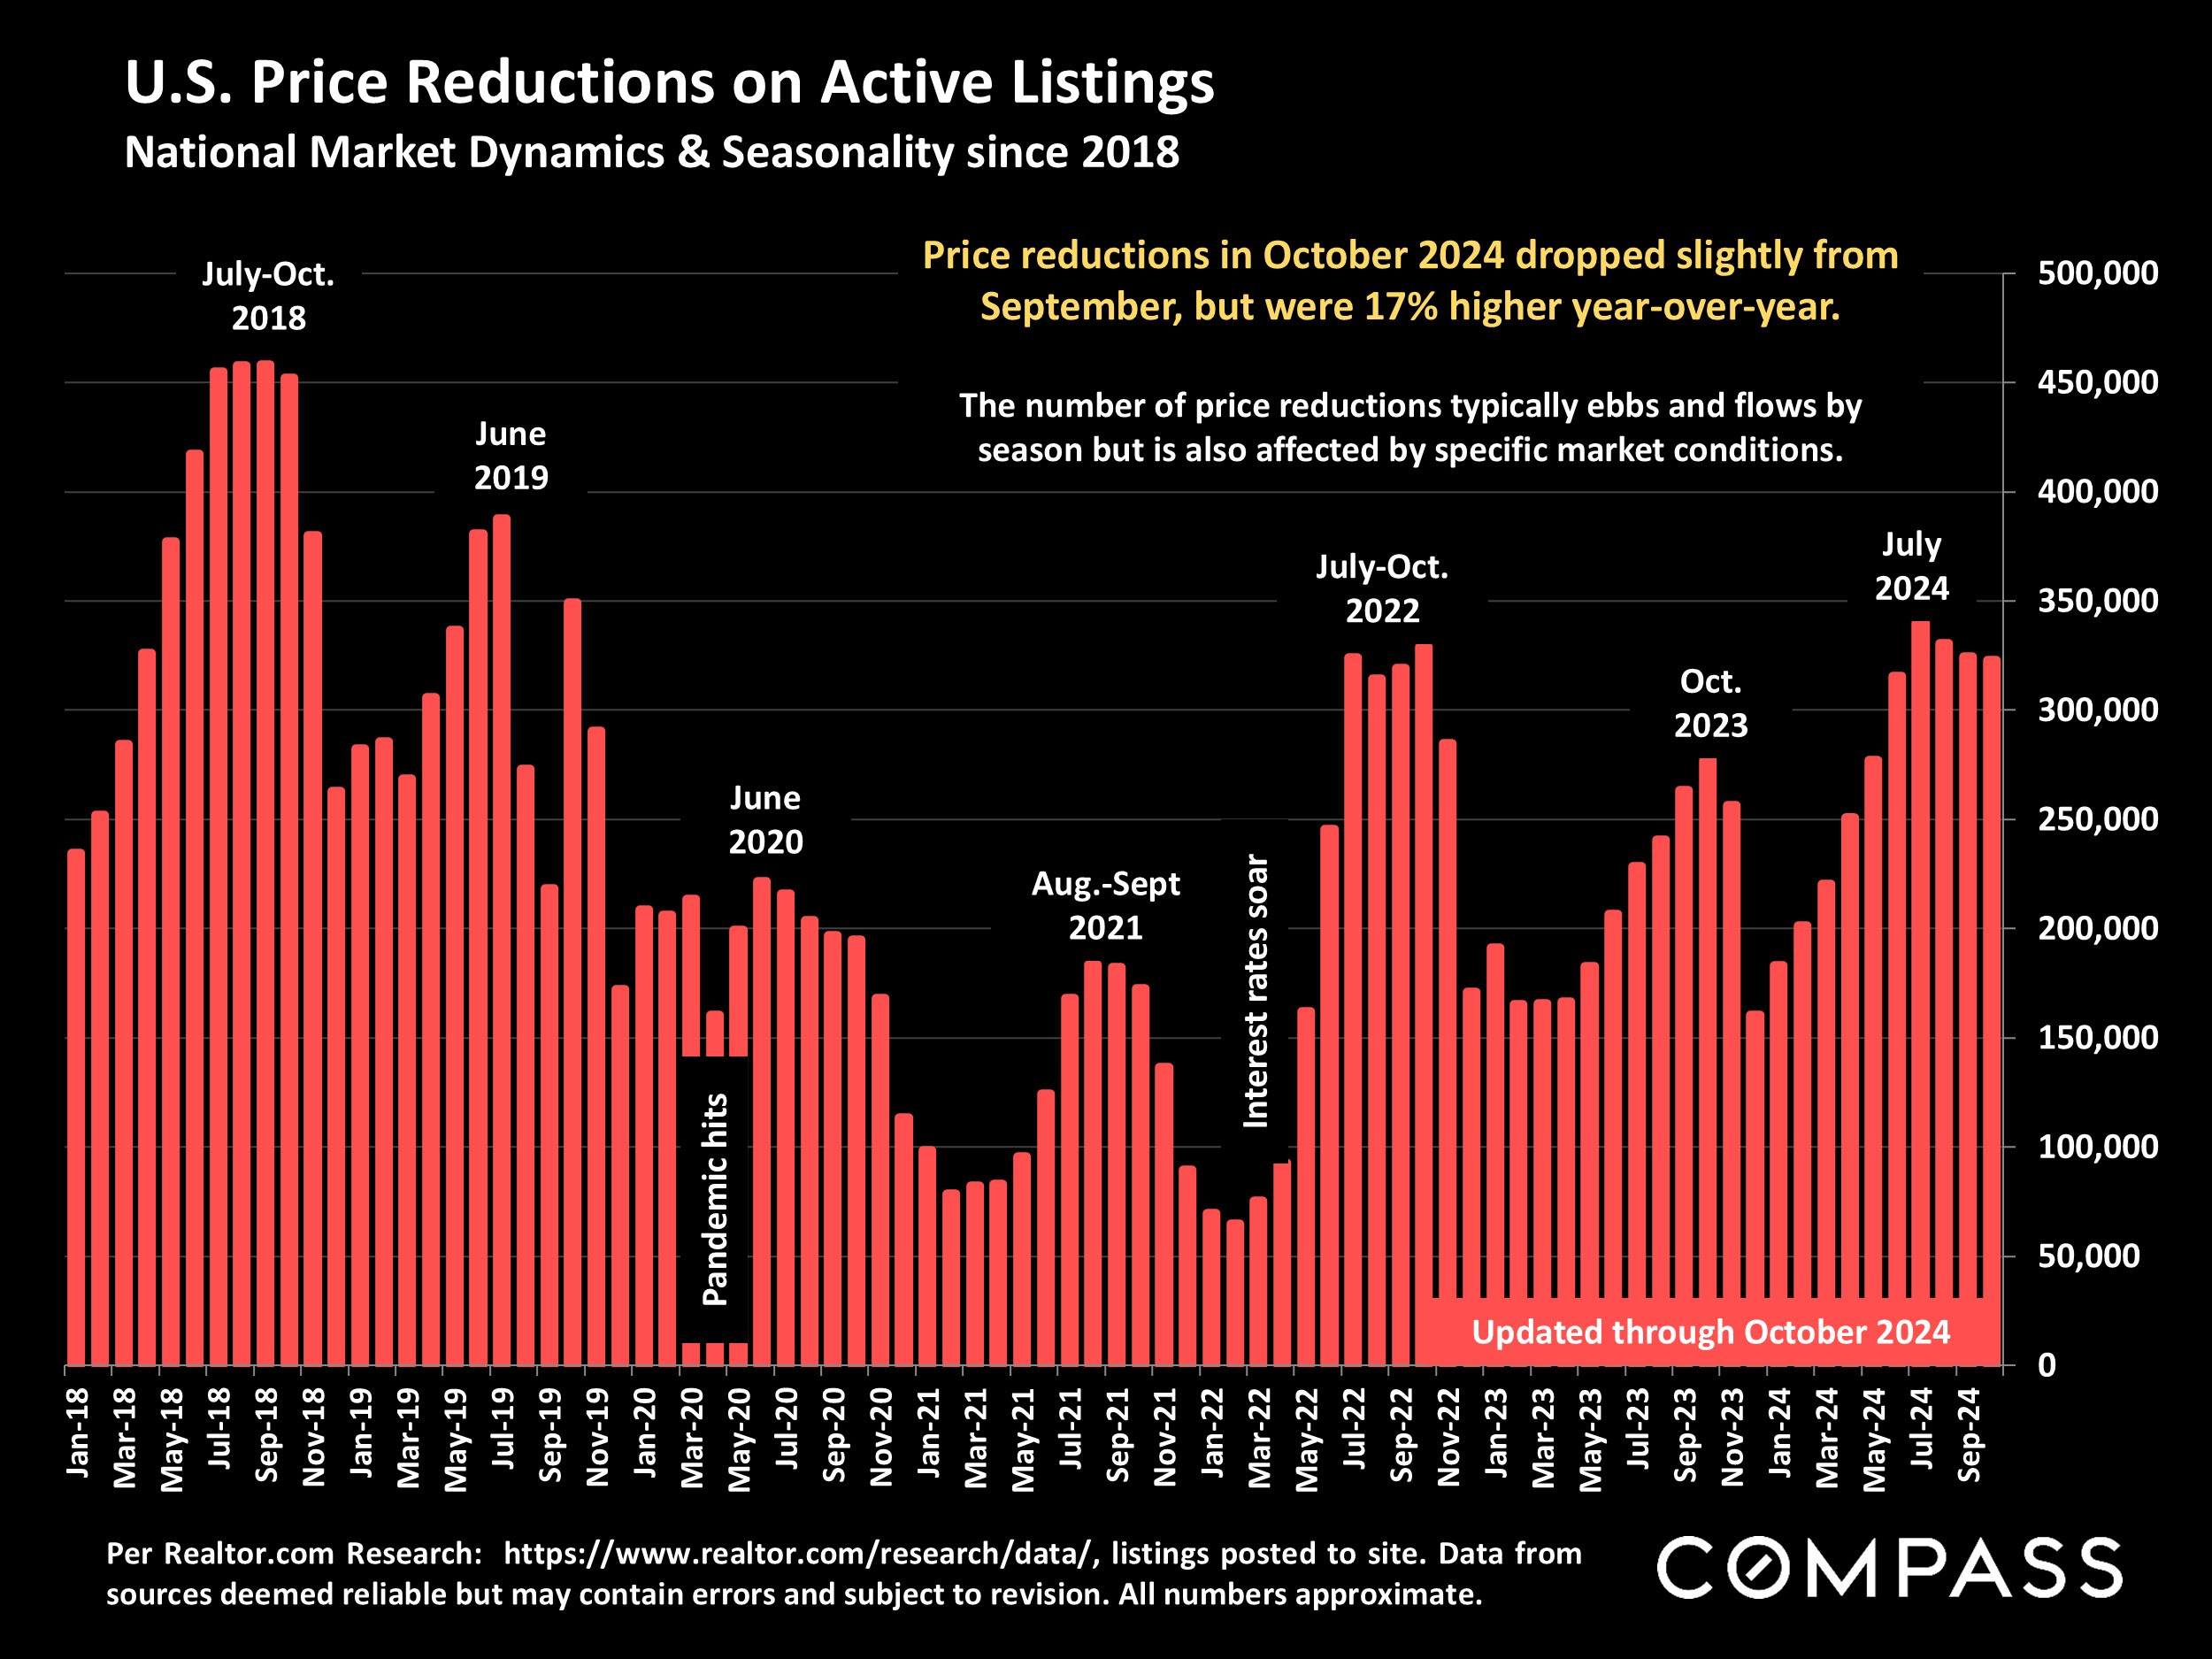
Though many homes still sell quickly with multiple offers for over asking price, the number of price reductions has climbed higher in 2024. Buyers have decided that hundreds of thousands of listings were simply priced too high.
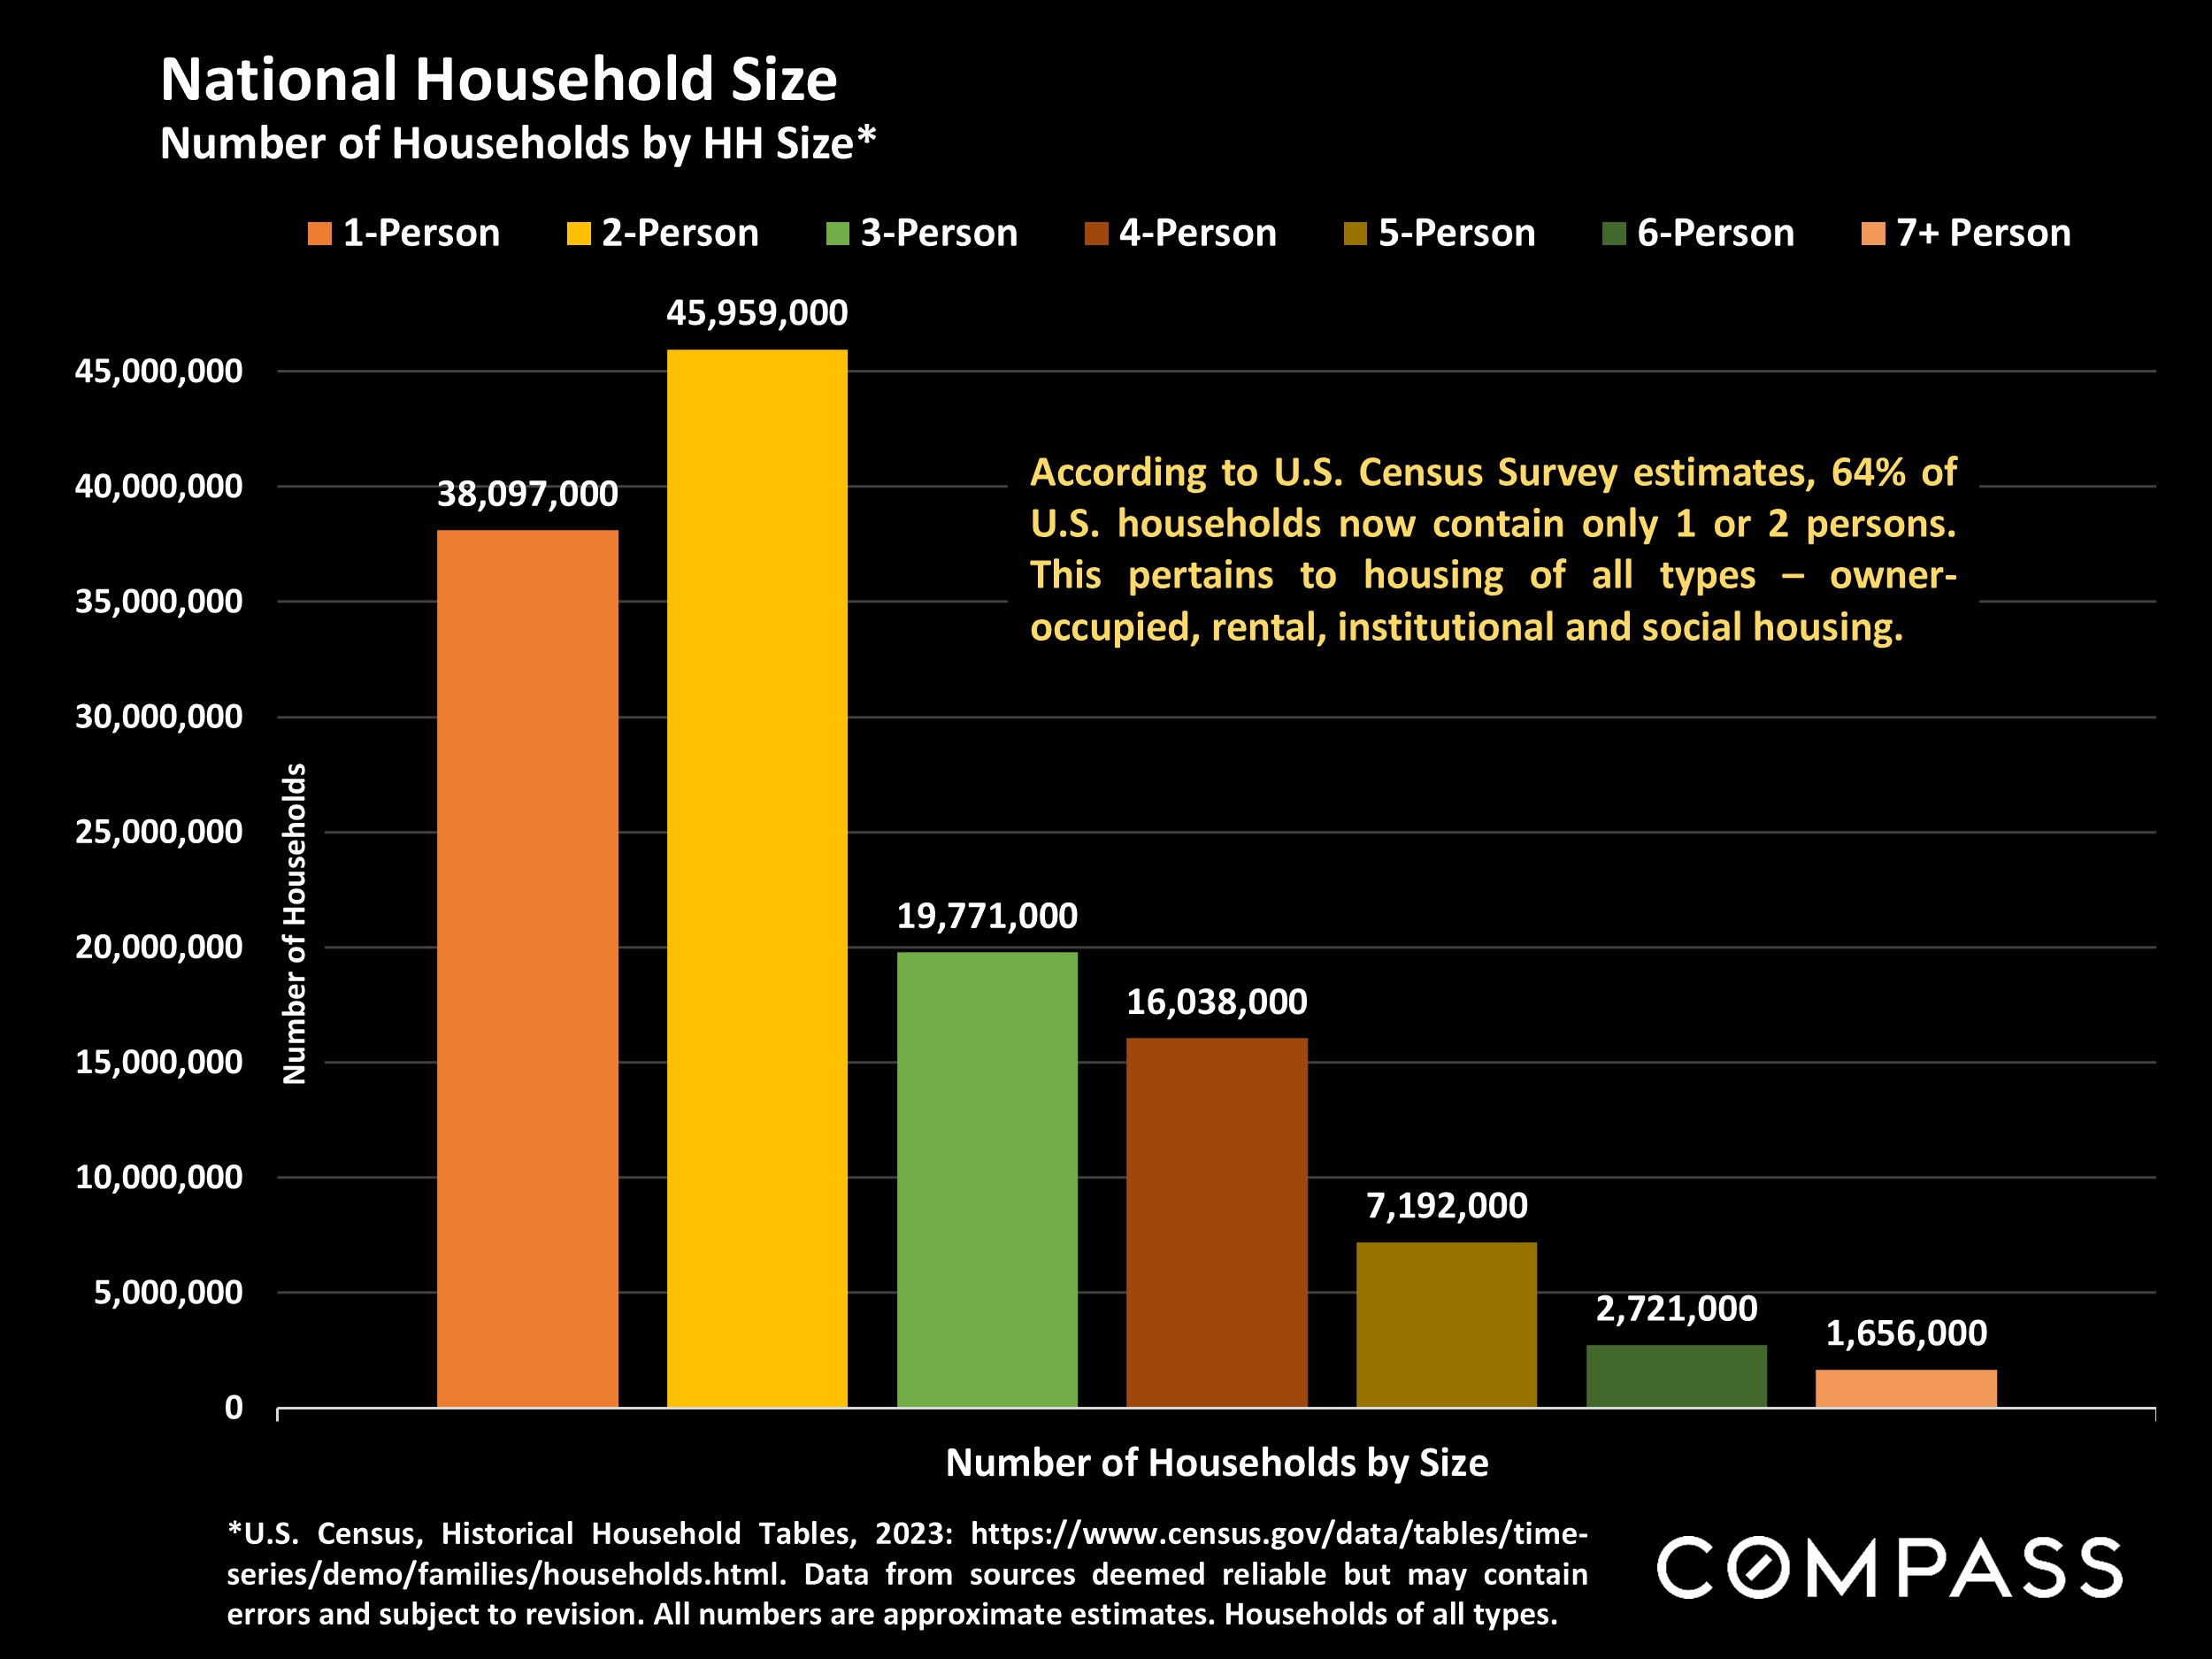
Reflecting substantial demographic shifts in recent decades, the U.S. is now dominated by 1 and 2-person households, which has significant ramifications for the national housing market.
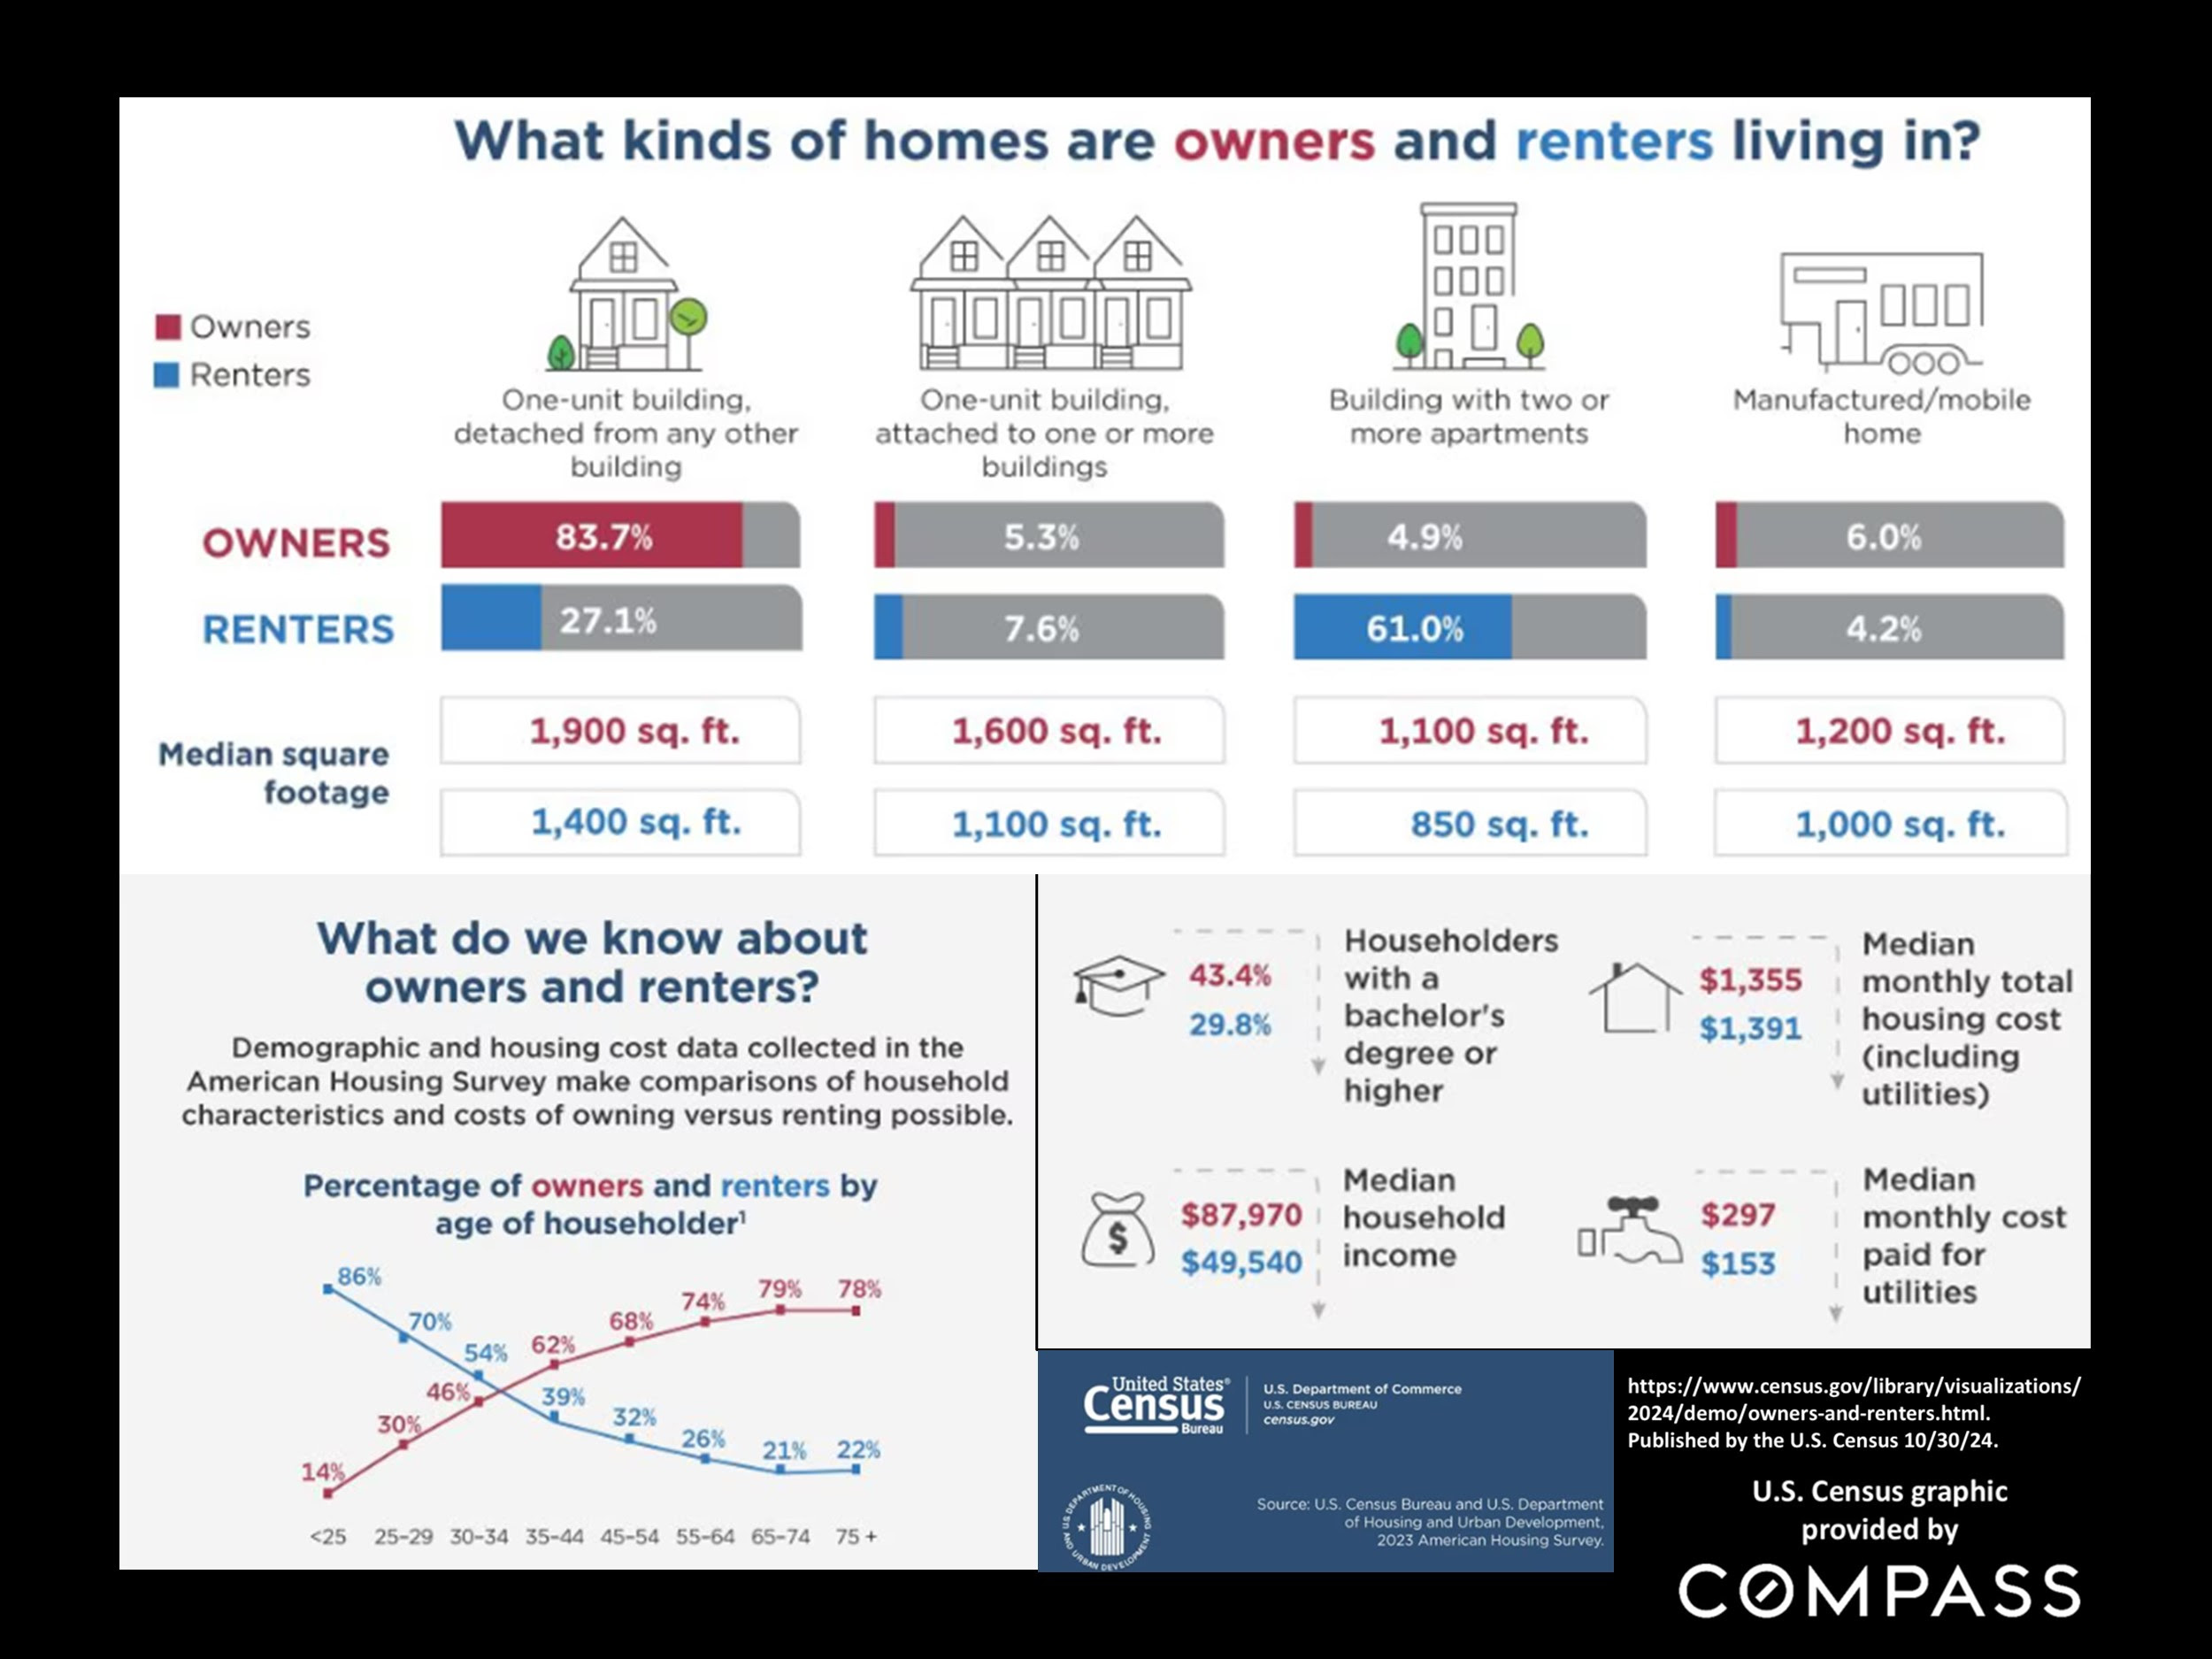
The U.S. Census released its latest data comparing selected economic and demographic characteristics of home owners and renters.
Wishing you and yours a safe, healthy and happy holiday season. Please let me know if I can ever be of any assistance to you, your family, friends or colleagues.


